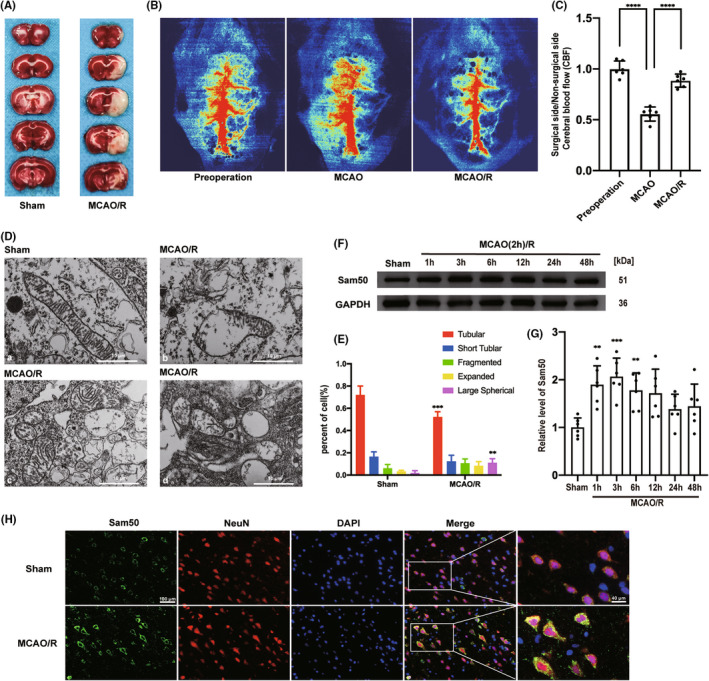
FIGURE 1.

Mitochondrial damage and Sam50 protein levels increased in penumbra neurons after MCAO/R in rats. (A) Representative coronal brain sections at the scheduled times after MCAO/R. (B) Speckle imaging of cerebral blood flow before the operation, after MCAO, and after MCAO/R. (C) Statistical results of cerebral blood flow speckle imaging of preparation, after MCAO and after MCAO/R (****p < 0.0001 MCAO vs. pre‐operation group, ****p < 0.0001 MCAO/R vs. MCAO, n = 6). (D) Electron microscopy of mitochondria before and after MCAO/R, (a) normal structure of mitochondria in the sham group, (b) collapse of the crista junctions (CJs) found in the MCAO/R group, (c) star‐shaped crista of the mitochondria of MCAO/R group, (d) and complete collapse of the inner mitochondrial membrane of MCAO/R group. (E) Percentage statistics of different structures of crista in cells (tubular crista: ***p < 0.001: p = 0.0004, MCAO/R vs. sham; large spherical crista: **p < 0.01, MCAO/R vs. sham: p = 0.0027; n = 6.). (F, G) Western blot analysis and quantification of Sam50 in penumbra tissue after MCAO/R (**p < 0.01, 1 h: p = 0.0017, ***p < 0.001, 3 h: p = 0.0002, **p < 0.01, 6 h: p = 0.0074 vs. sham group, n = 6). (H) Double immunofluorescence analysis was performed with antibodies against Sam50 (green) and a neuronal marker (NeuN, red) in brain sections. Nuclei were fluorescently labeled with 4,6‐diamino‐2‐phenylindole DAPI (blue). Scale bar =100 μm. All data were displayed as means ± SD, n = 6, and differences were calculated with ordinary one‐way ANOVA.
