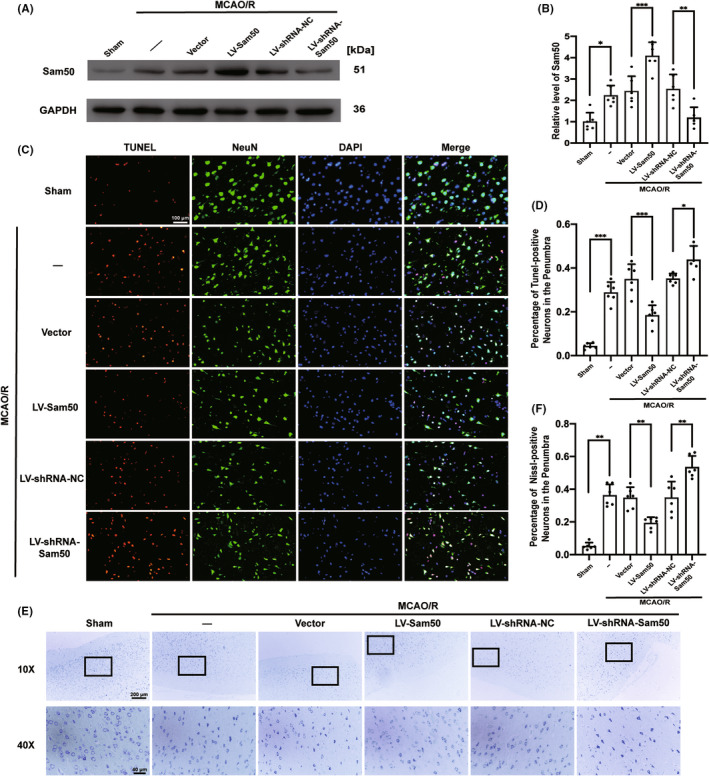
FIGURE 2.

Sam50 mitigated MCAO/R‐induced neuronal apoptosis and neurodegeneration in rats. (A, B) Western blot analysis and quantification of the effects of overexpression and knockdown of Sam50 (*p < 0.05 vs. sham: p = 0.0109; ***p < 0.001, LV‐Sam50 vs. Vector: p = 0.0004; **p < 0.01, LV‐shRNA‐NC vs. LV‐shRNA‐Sam50: p = 0.0048; n = 6). (C, D) Double staining for terminal deoxynucleotidyl transferase‐mediated dUTP nick end labeling (TUNEL) (red) neuronal marker (NeuN, green), nuclei were fluorescently labeled DAPI (blue), and scale bar =100 μm (***p < 0.001 vs. sham: p = 0.0007; ***p < 0.001: p = 0.0005, LV‐Sam50 vs. Vector; *p < 0.05, LV‐shRNA‐NC vs. LV‐shRNA‐Sam50: p = 0.0385, n = 6). (E, F) Nissl staining and statistics (select the black rectangle area to magnify) and statistic of Nissl staining positive ratio (**p < 0.01, vs. sham: p = 0.0073; **p < 0.01, LV‐Sam50 vs. Vector: p = 0.0028; **p < 0.01, LV‐shRNA‐NC vs. LV‐shRNA‐Sam50: p = 0.0086; n = 6). All data were displayed as means ± SD; n = 6, and differences were calculated with ordinary one‐way ANOVA.
