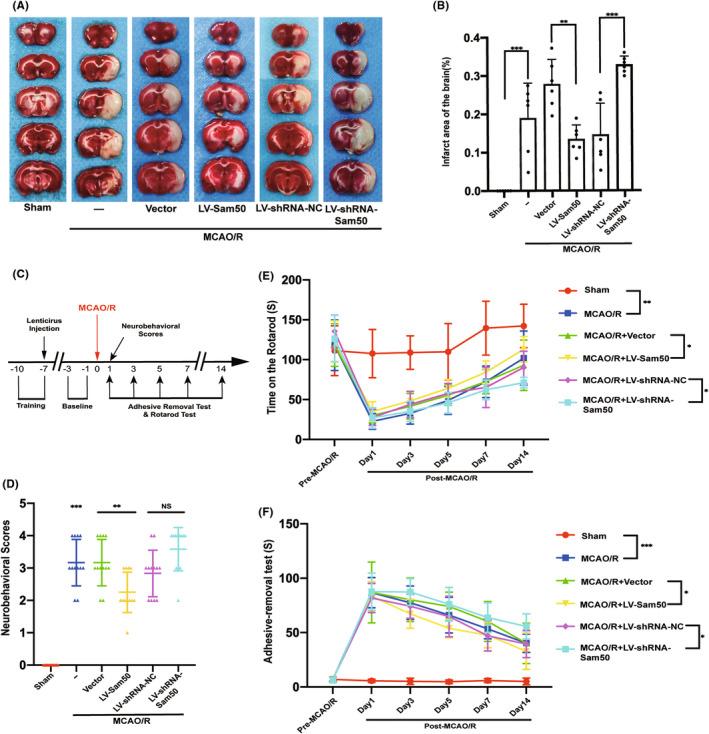
FIGURE 3.

Sam50 rescued MCAO/R‐induced infarction area and neurobehavioral in rats. (A, B) Triphenyl tetrazolium chloride (TTC) staining and statistics of the effects of overexpression and knockdown of Sam50 (***p < 0.001, vs. sham: p = 0.0004; **p < 0.01: p = 0.0027, LV‐Sam50 vs. Vector; ***p < 0.001, LV‐shRNA‐NC vs. LV‐shRNA‐Sam50: p = 0.0001, n = 6). (C) Behavioral experiment‐related process. (D) Neurological Scoring (***p < 0.001, vs. sham: p = 0.0003; **p < 0.01, LV‐Sam50 vs. Vector: p = 0.0085; p > 0.05, LV‐shRNA‐NC vs. LV‐shRNA‐Sam50, n = 12). (E) Rotarod test at pre‐MCAO/R, 1, 3, 5, 7, and 14 days of post‐MCAO/R (**p < 0.01, vs. sham: p = 0.0088; *p < 0.05, LV‐Sam50 vs. Vector: p = 0.0256; *p < 0.05, LV‐shRNA‐NC vs. LV‐shRNA‐Sam50: p = 0.0462, n = 12). (F) Adhesive removal time (***p < 0.001, vs. sham: p = 0.0007; *p < 0.05, LV‐Sam50 vs. Vector: p = 0.0124; *p < 0.05, LV‐shRNA‐NC vs. LV‐shRNA‐Sam50: p = 0.0256; n = 12). All data were displayed as means ± SD, n = 6 for (A, B), n = 12 for (C, D, E, F), and differences were calculated with two‐way ANOVA for (E, F) and ordinary one‐way ANOVA for (B, D).
