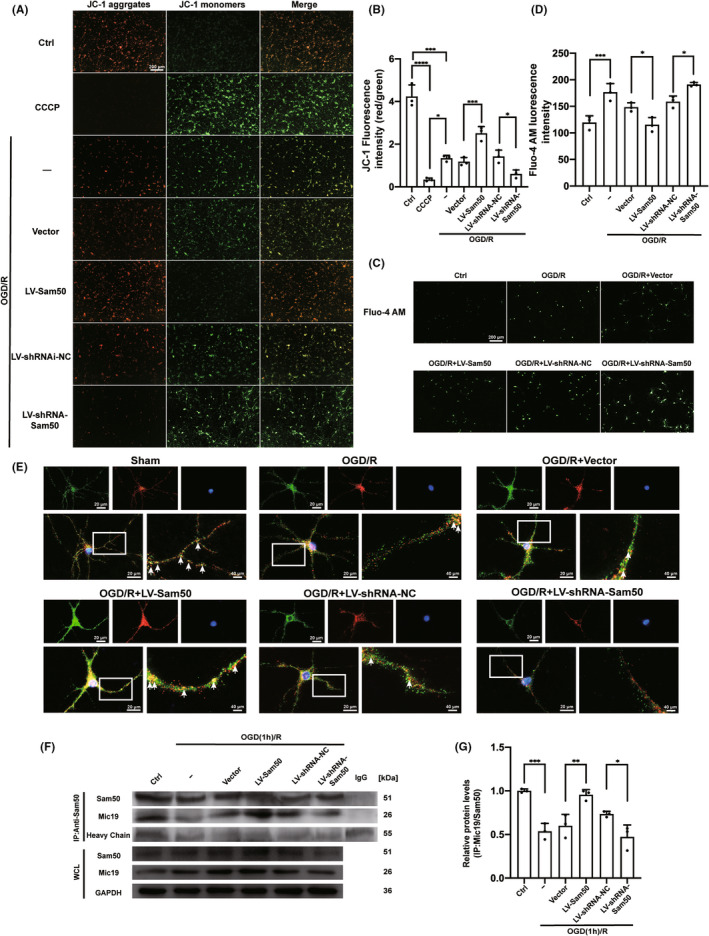
FIGURE 6.

Changes in mitochondrial membrane potential (MMP) and Ca2+ content under different expressions of Sam50 after OGD/R. (A, B) JC‐1 staining: red (JC‐1 aggregates) represents higher MMP, green (JC‐1 monomers) represents lower MMP (***p < 0.001, OGD/R vs. Ctrl: p = 0.0007; ****p < 0.0001, CCCP vs. Ctrl; *p < 0.05, CCCP vs. OGD/R: p = 0.0113; ***p < 0.001, LV‐ Sam50 vs. Vector: p = 0.0010; *p < 0.05, LV‐shRNA‐NC vs. LV‐shRNA‐Sam50: p = 0.0471; scale bar =200 μm, n = 3). (C, D) Fluo‐4 AM staining: the fluorescence intensity is proportional to the accumulation of Ca2+ (***p < 0.001 vs. Ctrl: p = 0.0007; *p < 0.05, LV‐Sam50 vs. Vector: p = 0.0326; *p < 0.05, LV‐shRNA‐NC vs. LV‐shRNA‐Sam50: p = 0.0462; scale bar =200 μm, n = 3). (E) Double staining for Sam50 (green) and Mic 19 (red), and nuclei were fluorescently labeled DAPI (blue). The fluorescence intensity of the three co‐staining represents the connection strength of the Sam50–Mic19 axis. (F) Mic19/Sam50 interactions in neurons after OGD/R. (G) Quantitative analysis was performed. The black dots represent individual data in each group. All data were displayed as Means ± SD; mean values for Ctrl group were normalized to 1.0; (***p < 0.001 vs. Ctrl: p = 0.0004; **p < 0.01, LV‐Sam50 vs. Vector: P = 0.0045; *p < 0.05, LV‐shRNA‐NC vs. LV‐shRNA‐Sam50: p = 0.0372, n = 3).
