
FIGURE 3.
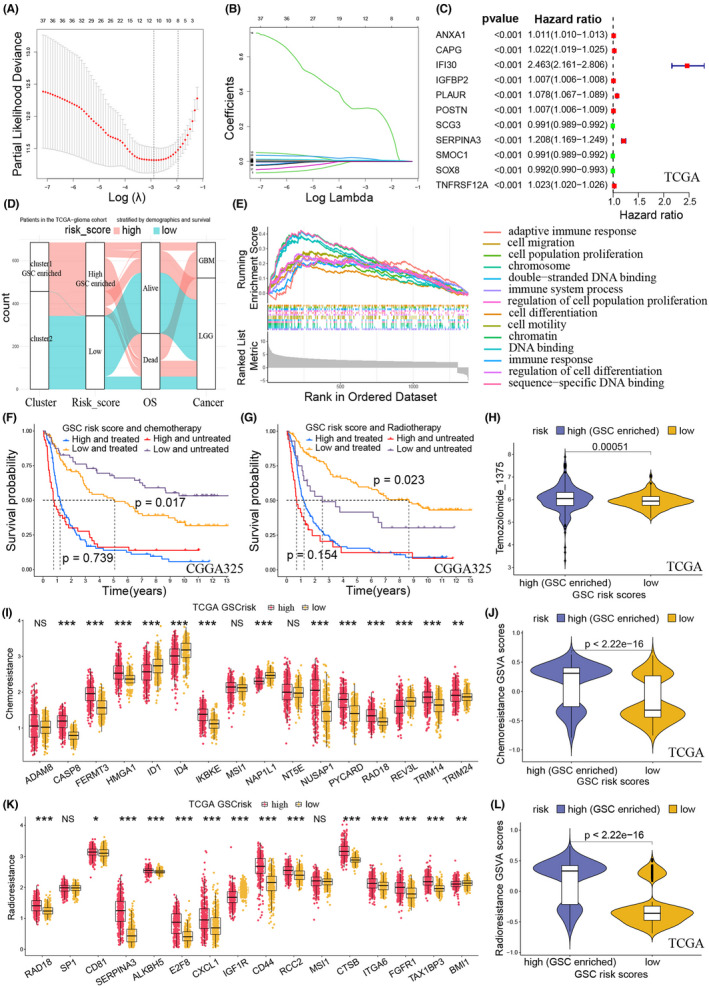
Construction of GSC risk scores and prediction of chemo‐radiotherapy resistance. (A) Coefficient profiles of the least absolute shrinkage and selection operator (LASSO) regression model. (B) Cross‐validation of tuning parameter screening in the LASSO regression model. (C) Univariate logistic regression identified 11 GSC genes' hazard ratios (HRs) and 95% confidence intervals (CIs) after LASSO regression filtration in the TCGA training cohort. (D) Sankey diagram showing high consistency between GSC‐associated clusters and risk scores. (E) Gene Set Enrichment Analysis (GSEA) function enrichment for the differentially expressed genes between the two risk‐score groups. (F) Kaplan–Meier curves of risk scores in patients receiving and not receiving chemotherapy in the CGGA325 cohort. (G) Kaplan–Meier curves of risk scores in patients receiving and not receiving radiotherapy in the CGGA325 cohort. For the low‐risk scores, there were significantly different survival rates between the patients receiving and not receiving chemo‐radiotherapy. For the high‐risk scores, the disparity of survival rates disappeared. (H) IC50 values of temozolomide in the two risk scores for the TCGA cohort. Patients in high‐risk scores had higher IC50 values of temozolomide. (I) Expression of chemoresistance feature genes in the two risk scores for the TCGA cohort. (J) Gene Set Variation Analysis (GSVA) scores of chemoresistance in the two risk scores for the TCGA cohort. Patients in high‐risk scores had higher chemoresistance. (K) Expression of radioresistance feature genes in the two risk scores for the TCGA cohort. (L) GSCA scores of radioresistance in the two risk scores for the TCGA cohort. Patients in high‐risk scores had higher radioresistance.