
FIGURE 4.
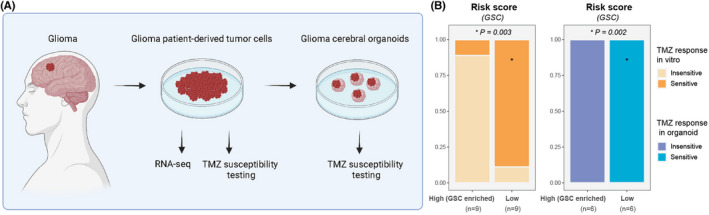
Temozolomide sensitivity validation for risk scores. (A) Schematic of major stages in the TMZ susceptibility experiments. (B) Bar chart showing the proportions of TMZ‐sensitive responses between the patients with high‐ and low‐risk scores. Patients with high‐GSC‐risk scores had significantly lower proportions of TMZ‐sensitive response.