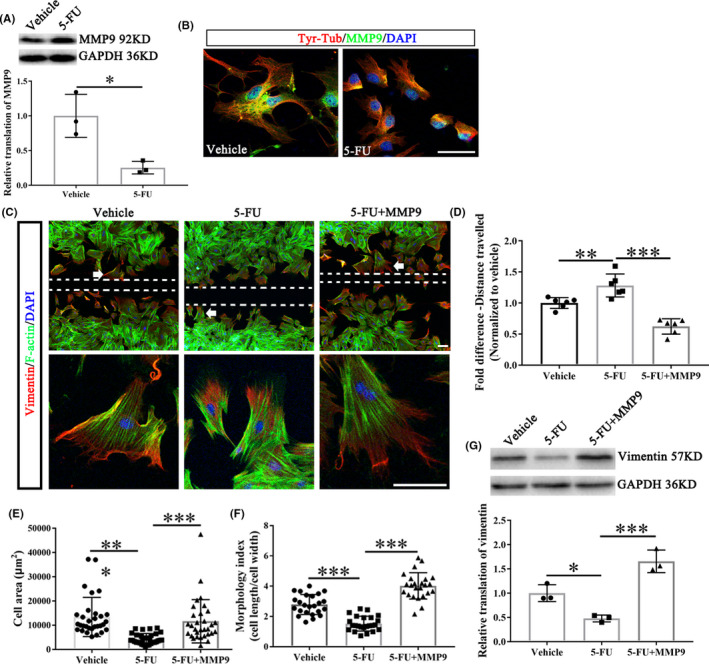
FIGURE 5.

5‐Fu treatment inhibits fibroblasts migration through reducing MMP9. (A) The representative protein bands show the levels of MMP9 in the fibroblasts treated with or without 5‐FU (n = 3/group). (B) The meningeal fibroblasts were stained with tyrosinated tubulin (Tyr‐Tub, dynamic microtubules), MMP9 and DAPI. Scale bar = 50 μm. (C) Meningeal fibroblasts stained for vimentin, F‐Actin and DAPI in vehicle and 5‐FU groups with or without rMMP9. The bottom panel indicated the enlarged views of white arrow showing areas. Scale bar = 100 μm for all panels. (D) The size of the wound was presented as the fold change among different group (n = 6/group). (E) Cell area quantifications of fibroblasts near the wound center (area of white dotted line in Figure C) (n = 30/group). (F) Morphology index of fibroblasts with or without indicated treatments (n = 24/group). (G) The protein level of vimentin (n = 3/group). DAPI (blue) labeled cell nucleus. Graphical data are presented as the mean ± standard deviation. *p < 0.05, **p < 0.01, ***p < 0.001
