
Figure 2.
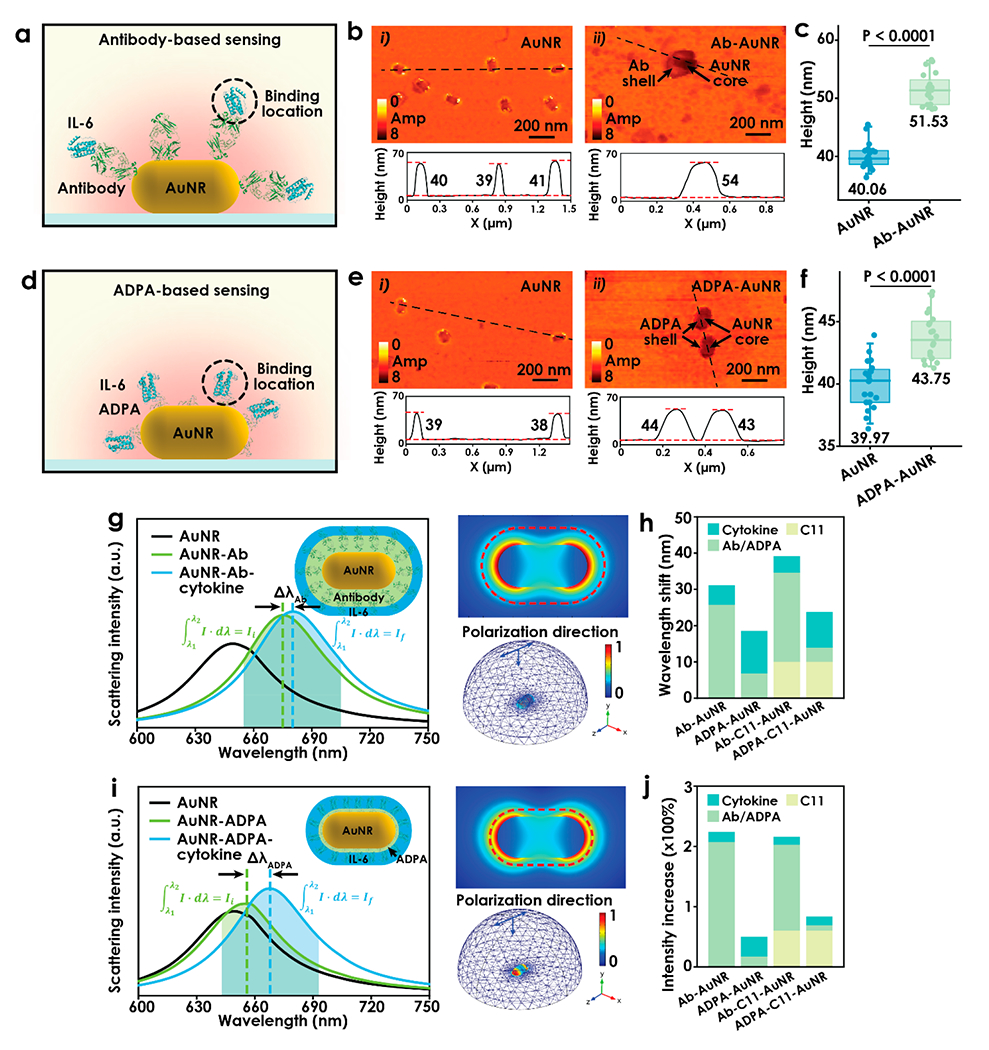
(a, d) Respective illustrations of typical antibody- and APDA-antigen binding scenarios in LSPR sensing scheme, where the binding occurs at different locations from AuNR-dielectric interface. (b, e) Respective representative s-SNOM images of isolated AuNRs patterned on the substrate and antibody/ADPA directly functionalized on AuNR. Bottom shows cross-sectional profiles of particles taken along the dashed line. (c, f) Statistics of particle heights of AuNR/Ab-AuNR and AuNR/APDA. Each dot represents an individual measurement of the particles (n = 20). Box plots depict the 25th percentile, median, and 75th percentile; whiskers show the 95% confidence intervals. (g, i) Predicted scattering spectra of AuNR, AuNR coated with Ab/ADPA, and after binding with cytokine. A 2D illustration of the model is given in the top-right corner in the plot, and 2D and 3D electromagnetic field distributions are given in the top-right and bottom-right corners, respectively. (h) Comparison of scattering resonance wavelength shift induced in each step. (j) Comparison of relative scattering intensity increase in each step.