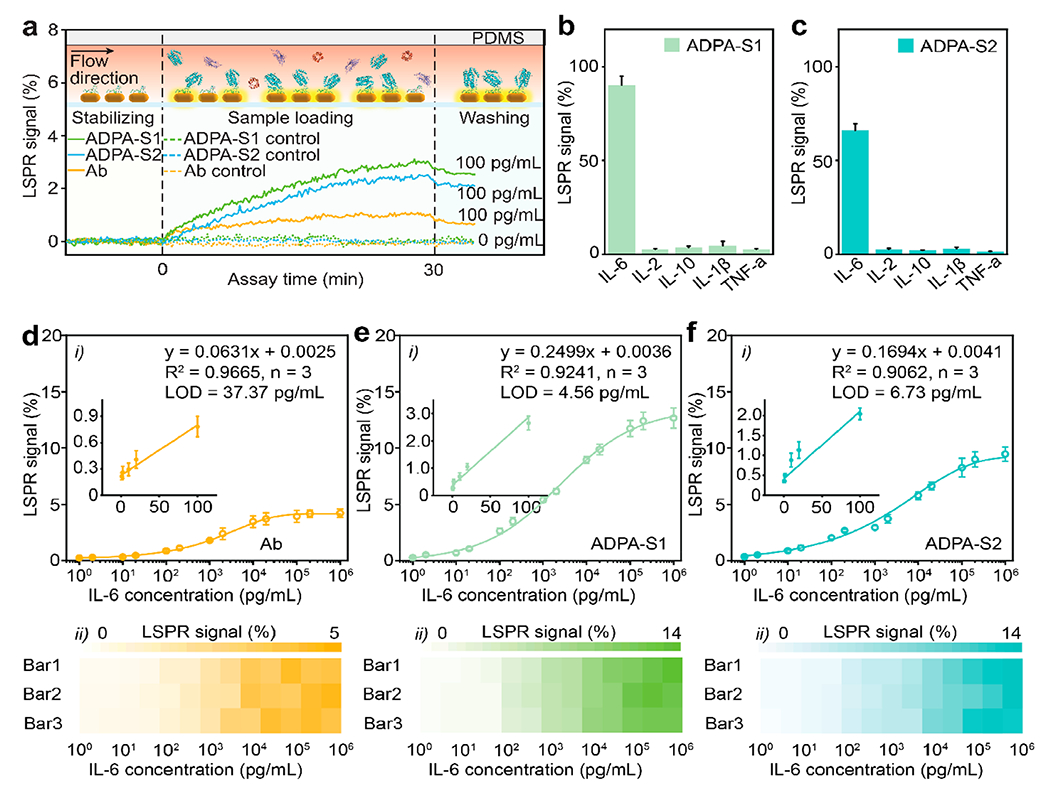
Figure 3.

(a) Real-time monitoring of scattering light intensity change during a LSPRi immunoassay. (Top) Cross-sectional views of the channel during baseline establishment, sample loading, and washing process. (b, c) Selectivity test for ADPA-Scheme 1 and ADPA-Scheme 2. (d–f) Calibration curves for Ab (panel (d)), ADPA-Scheme 1 (panel (e)), and ADPA-Scheme 2 (panel (f)) LSPRi immunoassay. Insets show the corresponding linear regions of the calibration curves. The bottom panels present the corresponding heatmaps of the LSPR signals.
