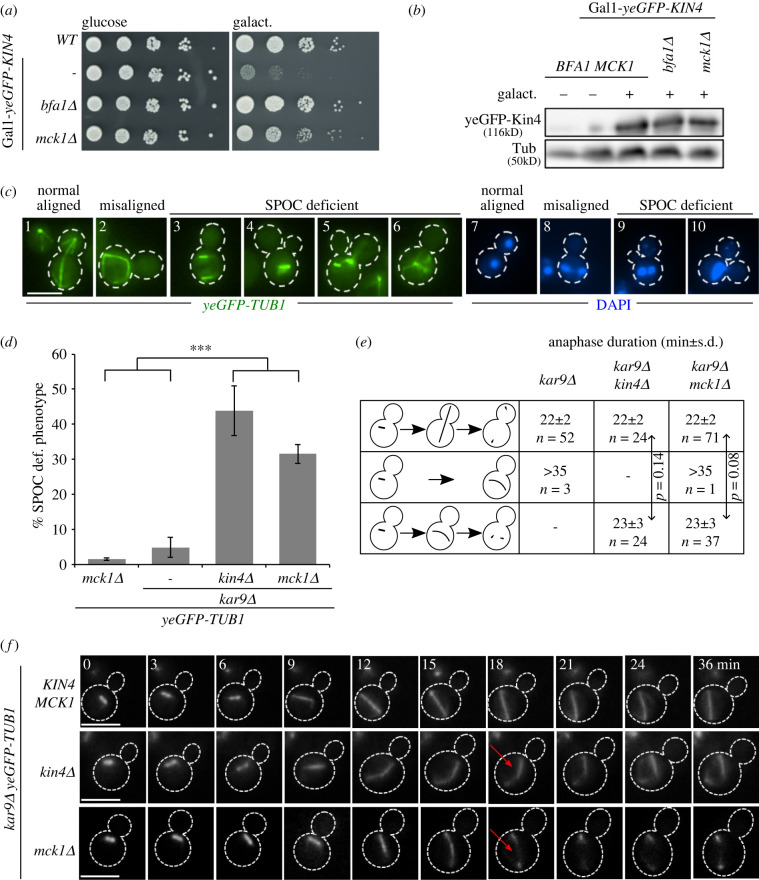
Figure 1.
Mck1 is a novel SPOC component. (a) Serial dilutions of the indicated strains were spotted on the Gal1-KIN4 repressing (glucose) and Gal1-KIN4 inducing agar plates containing galactose (galact.) and incubated at 30°C for 3 days. (b) Immunoblot shows expression levels of yeGFP-Kin4 in the presence and absence of galactose as indicated. Tubulin (Tub) served as a loading control. (c,d) Representative images of SPOC deficient cells (c) and SPOC analysis of strains are indicated in (d). Cells were fixed and analysed for yeGFP-tubulin and DNA content by DAPI staining. Dashed lines mark the cell boundary. SPOC deficient phenotypes were scored in (d) based on tubulin staining (n = 100 cells per strain and experiment). The graph depicts average ± s.d. of SPOC deficient phenotypes from three independent experiments. Asterisk indicates a significant difference based on the two-tailed Student's t-test, p < 0.05 (*), p < 0.001 (**) and p < 0.0001 (***). (e,f) SPOC analysis by live cell imaging. Anaphase duration (e) and still images (f) are shown for kar9Δ (n = 55), kar9Δ kin4Δ (n = 48) and kar9Δ mck1Δ (n = 109) cells. The quantifications in (e) show anaphase duration (mean ± s.d.) for cells with normal or misaligned spindles as depicted. Still images in (f) show cells in which the spindle elongated in the mother cell body; t = 0 was defined as the time prior to the beginning of spindle elongation. Cell boundaries are marked by dashed lines and red arrow indicates spindle disassembly. Scale bars, 3 µm.

