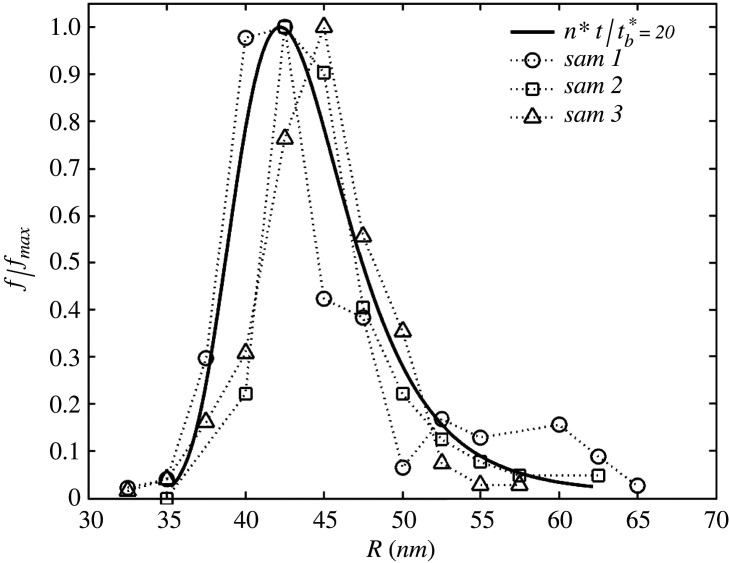
Figure 6.
Distribution of the normalized statistical frequency f/fmax versus virion radius R. The theoretical prediction (solid line) is generated with the proposed model, assuming hereditary size and exponential replication from equation (3.4) and (3.5). Taking as a fitting parameter, the prediction is compared against experimental observation on virion size polydispersity for SARS-CoV-2 [11], on three virus populations samples (sam 1, 2, and 3).

