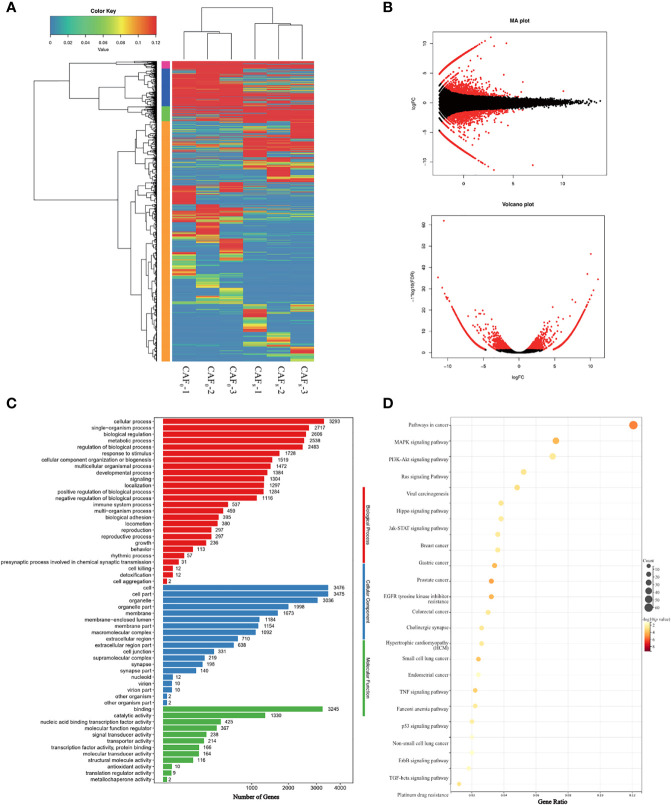
Figure 3.
Identification and functional characterization of CAFs under 0Gy and 8Gy irradiation. (A) The cluster analysis of 0Gy compared to 8Gy irradiated CAFs (3 samples for each group) and the heat map showed that the irradiated CAFs differed more significantly at the gene level; (B) Volcano plot of differential genes after 0Gy vs. 8Gy irradiation of CAFs; (C) Gene Ontology (GO) analysis of differentially expressed genes; (D) Kyoto Encyclopedia of Genes and Genomes (KEGG) analysis of differentially expressed genes.

