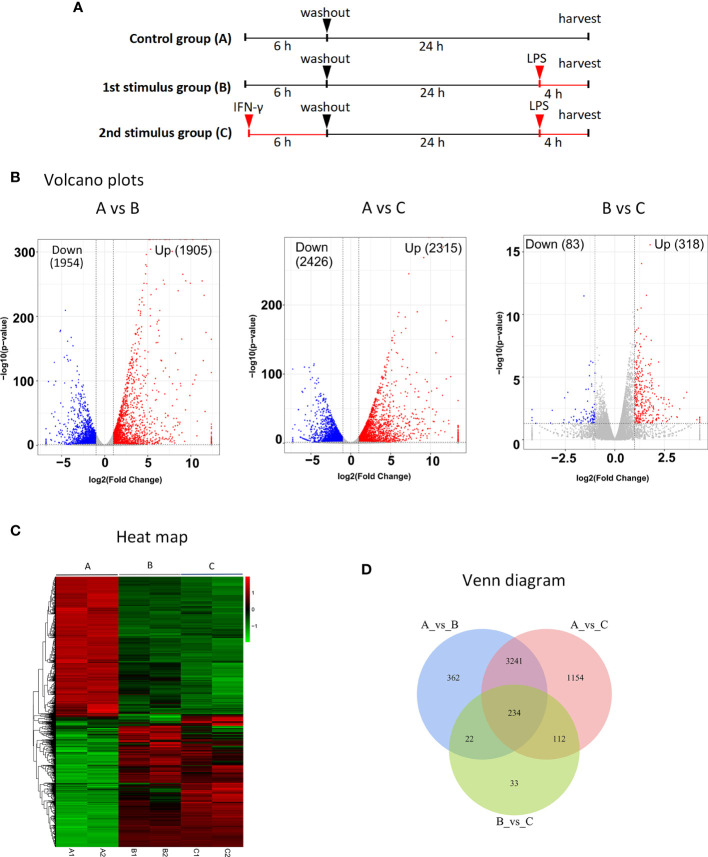
Figure 2.
RNA-seq identification of DEGs after secondary stimulation of BMDMs in MRL/lpr mice (A) Experimental design for RNA-seq. The MRL/lpr mice’s BMDMs were divided into control group (A), primary stimulation group (B) and secondary stimulation group (C). Group A and group B were not treated, and group C was treated with IFN, washed after 6 hours, then incubated without IFN for 24 hours, and group B and group C were stimulated with LPS for 4 hours at the same time. DESeq was used for differential analysis of gene expression, and the conditions for screening DEGs were: |log2FoldChange| > 1, P-value<0.05. (B) Volcano plots of DEGs significantly up-regulated after secondary stimulation. Log2FoldChange is the abscissa and -log10 (p-value) is the ordinate. The horizontally dotted line shows the P-value=0.05 threshold, and the two vertical line(dotted) are the 2-fold interpretation difference thresholds in the image. In this group, red dots represent genes that are up-regulated, blue dots indicate genes that are down-regulated, and grey dots suggest genes that are not statistically different. (C) Clustering of different gene expression in six samples.The horizontal lines represent genes, each column is a sample, red represents high-expressed genes, and green represents low-expressed genes. Each group has two parallel samples, namely A1, A2, B1, B2, C1, C2. (D) Venn diagram of a total of 234 identical DEGs between the three datasets. Of these, 191 genes were up-regulated in all three datasets.

