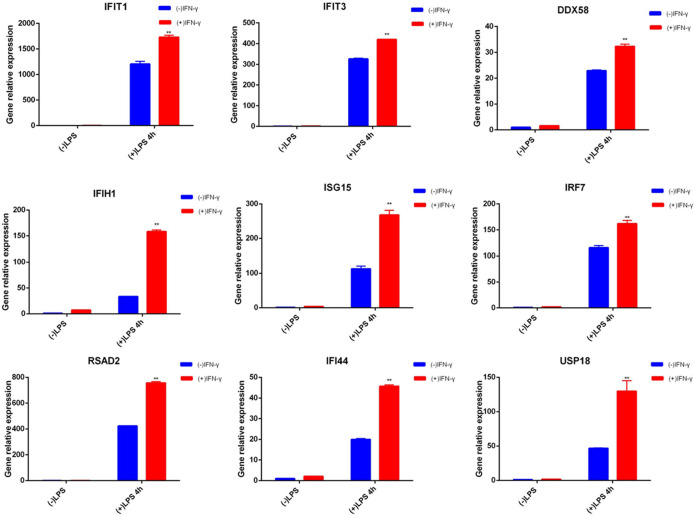
Figure 4.
qRT-PCR of related genes. Blue represents cells not pretreated with IFN-γ, and red represents cells treated with IFN-γ for 6 hours. The two groups of cells were treated with LPS for 4 hours after cultured in normal medium for 24 hours. ISG mRNA was measured by qRT-PCR, normalized by Gapdh, and expressed as fold induction. Nine genes are examples of memory ISGs in the transcriptome, respectively. Data represent the mean ± SD of three independent experiments. Statistically significant differences are indicated (Student’s t test, **P < 0.01).

