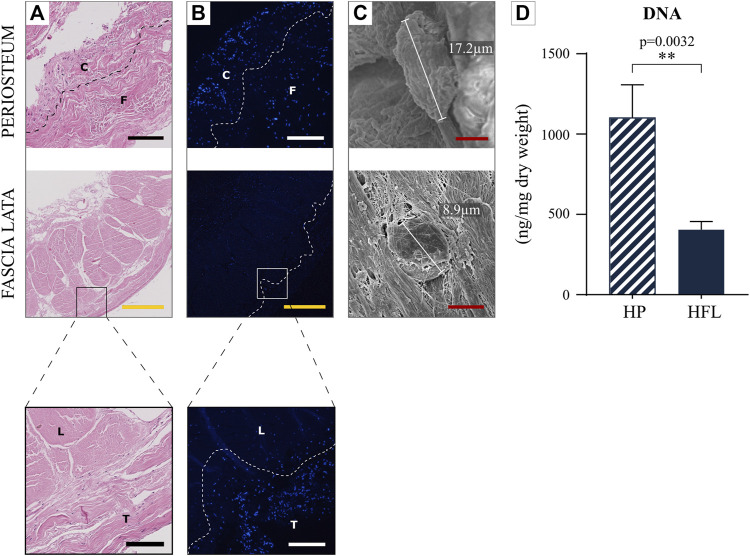
FIGURE 6.
Comparison of the HP and HFL by hematoxylin and eosin staining (A), by fluorescent cytochemistry (Hoechst) (B) (including zoom in), by electron microscopy (C) as well as DNA quantification (N = 4 donors x three samples from each donor leading to n = 12 specimens analyzed for each tissue) (D). C: cambial layer, F: fibrous layer, L: longitudinal layer, T: transverse layer, HP: human periosteum, HFL: human fascia lata. White/black scale bars: 100 µm. Yellow scale bars: 500 µm. Red scale bars: 5 µm.

