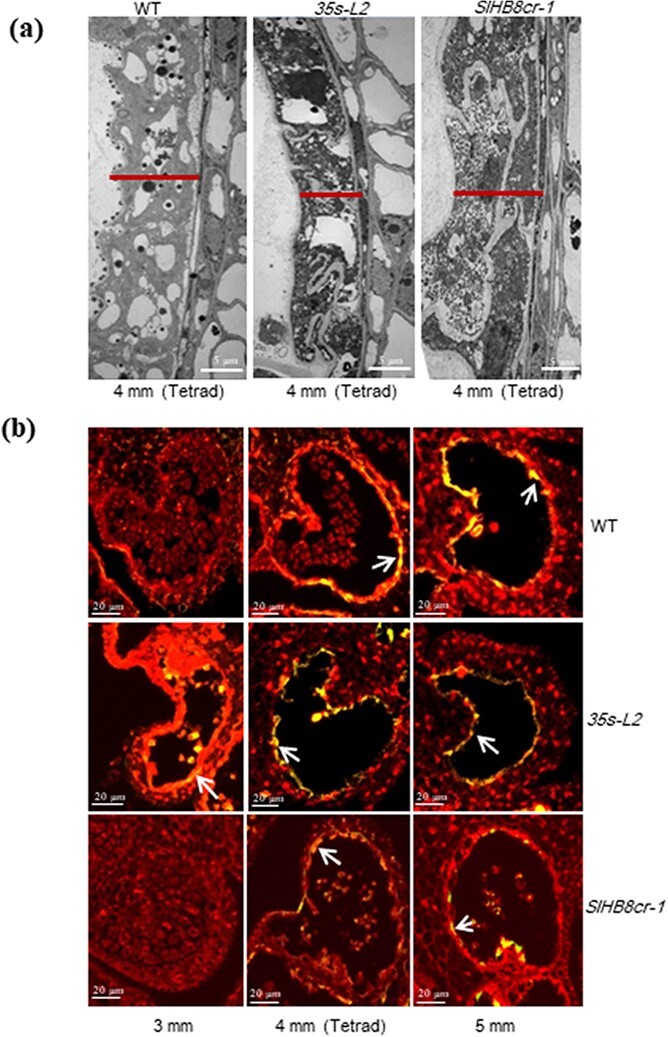
Figure 6.

Morphology of tapetum development and programmed cell death. a Transmission electron micrographs of anthers at the tetrad stage of wild-type, SlHB8 gene knockout and SlHB8 overexpression plants under control of the 35 s promoter. Scale bars = 5 μm. b Fluorescence microscopy of DNA fragmentation detected by TUNEL assays of anthers from wild-type, SlHB8 gene knockout and 35 s-L2 line plants at different stages. Scale bars = 20 μm.
