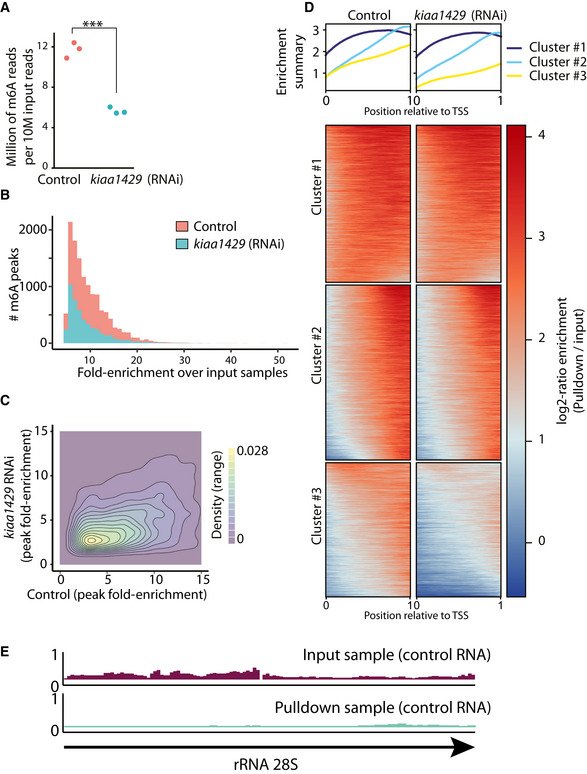
Figure EV2. m6A is abundant on planarian mRNA and depleted following kiaa1429 RNAi.

- The number of RNAseq reads for each m6A‐seq2 pulldown library per 10 M of the corresponding input reads is shown. The number of reads in each pulldown library in the m6A‐seq2 protocol correlates with the abundance of m6A (Dierks et al, 2021) (red and blue dot, control and kiaa1429 (RNAi) sample, respectively. ***Student's t‐test P < 0.001).
- The number of m6A‐rich regions (peaks) was larger in control samples and depleted following inhibition of kiaa1429. Moreover, the fold‐enrichment of the peaks in the control samples over the gene expression observed in the input samples is greater, in comparison to the kiaa1429 (RNAi) samples.
- A 2d‐density plot showing the correlation between m6A‐enriched regions in control and kiaa1429 (RNAi) animals. The density plot shows that m6a peaks were more highly enriched in the control samples compared to kiaa1429 (RNAi) samples, demonstrating the depletion of m6A following inhibition of kiaa1429.
- Profile of m6A‐enriched regions across genes in control and kiaa1429 (RNAi) showed enrichment toward the 3′‐end. The length of transcripts with detectable m6A‐enriched regions was normalized to 1,000 nt. Then, the expression across the transcript was computed by generating bins of gene expression (Materials and Methods) and calculating the log‐fold change between the anti‐m6A‐antibody pulldown library and the input sample. K‐means was used to separate three profiles of m6A‐enriched regions.
- Shown is the RPKM normalized expression of the planarian rRNA 28S (block arrow) in the m6A pulldown library and in control. There was no detectable m6A peak on planarian rRNA.
