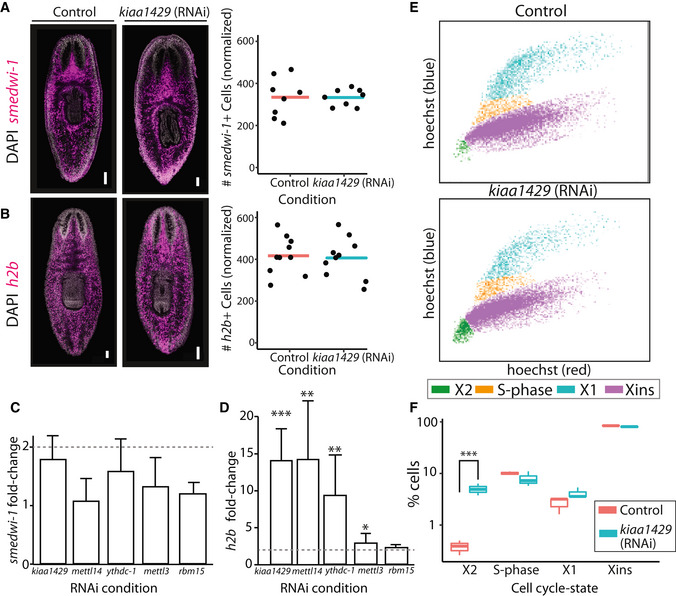
Figure 3. m6A pathway expression is not required for neoblast viability.

-
A, BThe number of neoblasts did not change significantly following inhibition of the MTC‐gene kiaa1429. Shown is FISH of smedwi‐1 (A) and h2b (B) in control and kiaa1429 (RNAi) animals (left). smedwi‐1 + or h2b + cells were counted following FISH and showed no significant difference in expression (right; bar represents average normalized cell count; Materials and Methods). Scale = 100 μm.
-
C, DGene expression analysis of smedwi‐1 (C) and h2b (D). The expression of smedwi‐1 and h2b was determined in the different RNAi conditions compared to the expression of these genes in control animals (Materials and Methods). Dashed line marks a twofold change in expression. Measurements performed on biological triplicates. P‐value was calculated by two‐sided Student's t‐test followed by Bonferroni correction for multiple hypotheses. Lack of asterisk indicated a non‐significant change in gene expression. Error bars indicate the 95% confidence interval (***P < 0.001, **P < 0.01, *P < 0.05).
-
ERepresentative FACS plots of cells isolated from control (top) and kiaa1429 (RNAi) animals (bottom) show an increase in cell abundance in the X2 gate (green; Materials and Methods).
-
FQuantification of the cells in each FACS gate in control and kiaa1429 (RNAi) animals showed a sixfold increase in the abundance of cells in the X2 gate (Student's t‐test ***P < 0.005). FACS experiments were performed in biological triplicates. Boxes represent the IQR, whiskers represent the 1.5 × IQR, and central band represents the median.
