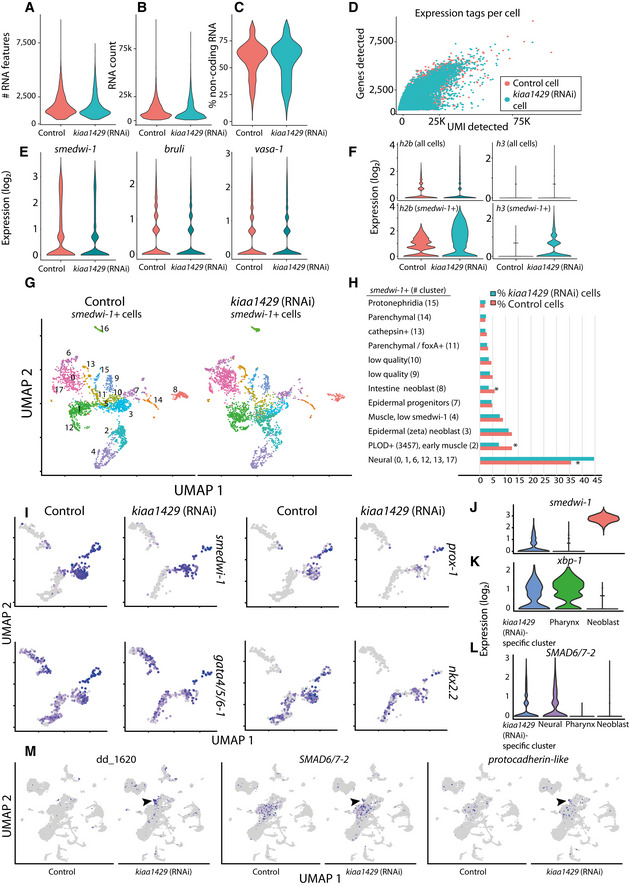
Figure EV5. Analysis of kiaa1429 (RNAi) phenotypes by scRNAseq.

-
A–DQuality measurements of scRNAseq libraries prepared from control and kiaa1429 (RNAi) cells. The quality of the libraries produced from both conditions was assessed using the Seurat package (Stuart et al, 2019). The number of expressed genes (A); unique molecular tags (B); non‐coding gene expression (C); and the correlation between the number of expressed genes and the unique molecular tags were highly similar between the libraries (D). This indicated that the quality of libraries was comparable.
-
EExpression levels of canonical neoblast markers were highly similar in control and kiaa1429 (RNAi).
-
FThe polyadenylated transcript expression of h2b and h3 was much higher in kiaa1429 (RNAi) animals compared to controls. The expression was detectable in neoblasts (bottom), and to a much lesser degree in the entire cell population (top), which includes neoblasts as well.
-
G, HUMAP representation of neoblasts (color dots, left panel), and their identity (right panel). Neoblast identity was assigned based on expression of previously published gene expression markers (Fincher et al, 2018). Most neoblast clusters were not affected by the RNAi, yet several lineages (right, asterisk) were differentially represented following kiaa1429 (RNAi).
-
IExpression of neoblast (smedwi‐1) and specialized intestine neoblast gene expression markers was overlaid on UMAP plots of the intestine lineage (cells represented by dots; gray and purple, low to high ranked expression).
-
J–LComparison of gene expression between several cell clusters. Importantly, pharynx cells are post‐mitotic, and therefore show minimal smedwi‐1 expression (J). Post‐mitotic cells express xbp‐1, which was previously shown to be expressed in differentiating and differentiated cells (Raz et al, 2021) (K). SMAD6/7–2 is expressed in the kiaa1429 (RNAi) specific‐cluster and in neural cells (L).
-
MHighly expressed genes in the kiaa1429 (RNAi)‐specific cluster compared to control are shown in UMAP plots. Contig dd_1620 is highly expressed in the kiaa1429 (RNAi)‐specific cluster. The genes SMAD6/7–2 and protocadherin‐like (dd_15376, gene model SMESG000067388) are expressed in the kiaa1429 (RNAi)‐specific cluster (black arrowhead); both genes are also expressed in cells of the neural clusters (e.g., cluster 2).
