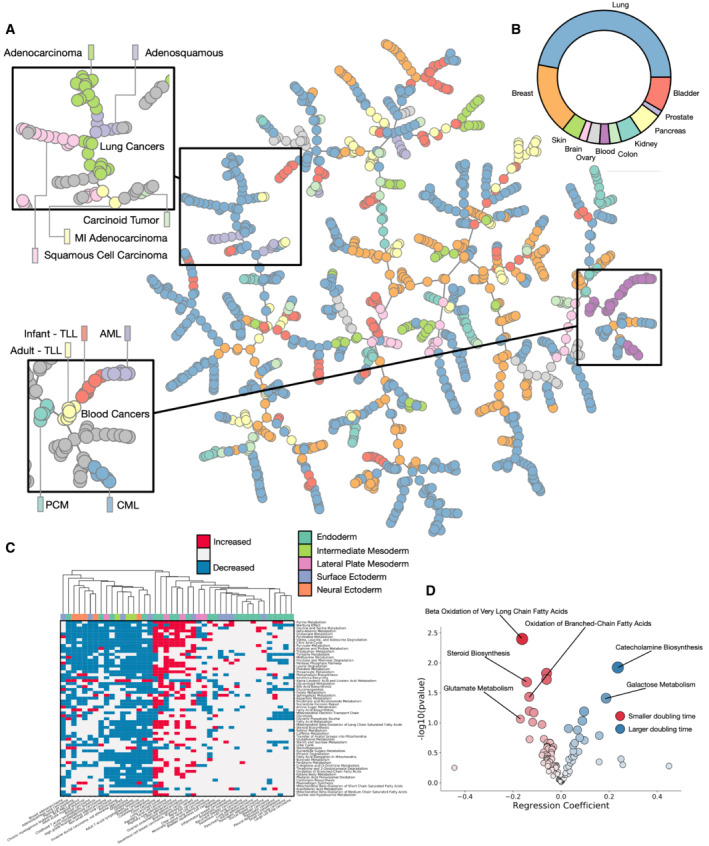
Figure 1. Metabolic profiling of cancer cell lines.

- T‐map representation of metabolic profiling data for 1,298 samples of cell lines from 11 different tissues showing clustering by cell types.
- Proportion of tissues in the dataset.
- Pathway variability for most significantly different SMPDB core metabolic pathways across major tissue types.
- Correlation of SMPDB core metabolic pathways with reported cell doubling time.
