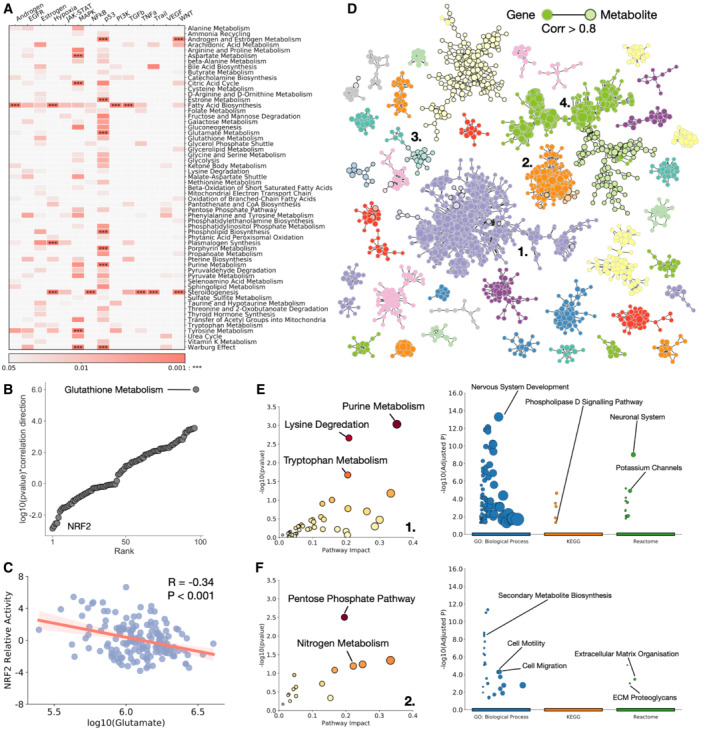
Figure 3. Transcriptional signatures associate with metabolic pathways.

- Heatmap of P‐value of association between SMPDB core metabolic pathways and progeny defined transcriptional programmes (P represents corrected iterative hypergeometric test P‐value).
- log10 (P‐value)*correlation direction against rank order for all SMPDB core metabolic pathways and their association with NRF2, showing glutathione metabolism as a clear outlier.
- log10 glutamate levels against NRF2 relative activity. R represents Pearson correlation coefficient.
- Network of correlated metabolites and genes across all RNA expression and metabolic data. Metabolites and genes are linked if their expression correlates with a Pearson correlation coefficient > 0.8. Plotted are all strongly connected components with 10 or more members.
- Enrichment of metabolites (left – Metaboanalyst) and genes (right – Gprofiler) in cluster 1.
- Enrichment of metabolites (left – Metaboanalyst) and genes (right – Gprofiler) in cluster 2.
