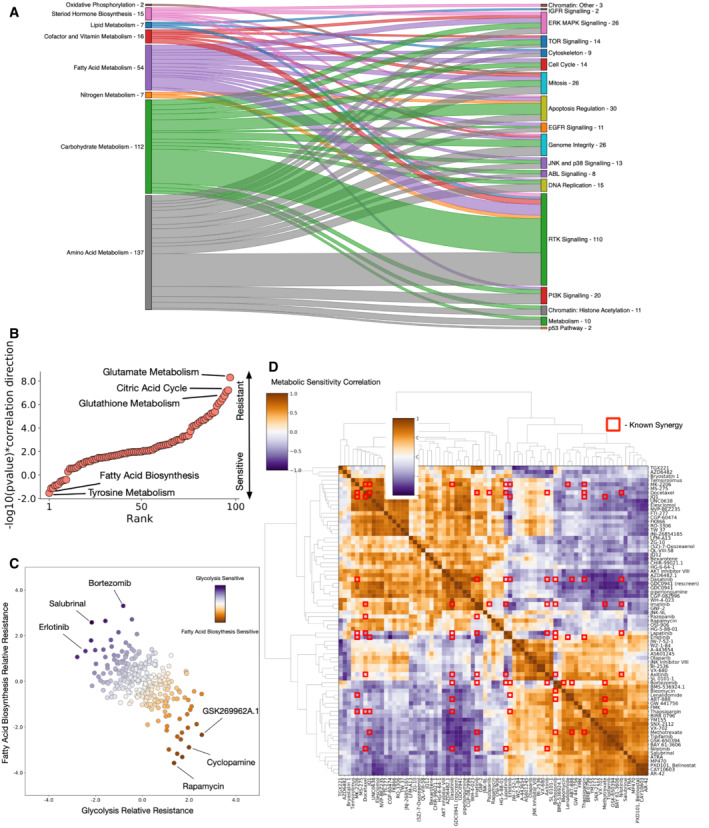
Figure 4. Metabolic activity correlates with drug sensitivity and resistance.

- Sankey plot of sensitivity associations (Pearson‐rho P‐value < 0.05) between metabolic pathway classes (left) and drug classes (right).
- −log10(P‐value)*correlation direction (iterative hypergeometric test) for associations between rapamycin IC50 and SMPDB core metabolic pathways, highlighting key pathways associated with resistance (positive) and sensitivity (negative) to rapamycin.
- Spectrum of relative resistance to glycolysis and fatty acid biosynthesis for all drugs studied, highlighting drugs with most extreme anticorrelation between the two pathways.
- Correlations between metabolic resistance associations for the most anticorrelated drugs. Metabolic pathway correlations against drug sensitivities are compared for all drugs. Red squares represent known drug synergies from DrugCombDB. Drug synergies tend to coincide with anticorrelated metabolic sensitivities.
