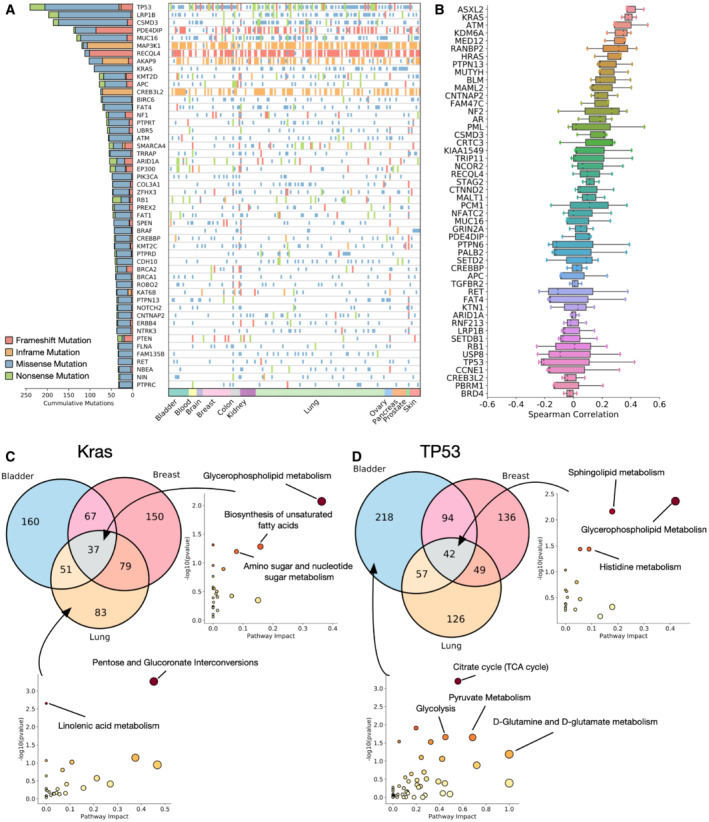
Figure 5. Tissue heterogeneity of metabolic changes associated with cancer‐driving mutations.

- Landscape of mutations in the top 50 most mutated cancer driver genes in the dataset.
- Mean Spearman correlation values between metabolite T‐statistics for each cancer driver mutation and metabolite pair calculated within a specific tissue. Higher correlation values indicate a higher tissue agnosticism in the metabolites associated with mutation of the gene.
- Metabolites significantly associated with KRAS mutations in breast, lung and bladder cancers. (right) Metabolic pathways conserved across all tissues, (bottom), pathways associated only with KRAS mutant lung cancer.
- Metabolites significantly associated with TP53 mutations in breast, lung and bladder cancers. (right) Metabolic pathways conserved across all tissues, (bottom), pathways associated only with TP53 mutant bladder cancer. P‐values represent Fisher's exact test.
