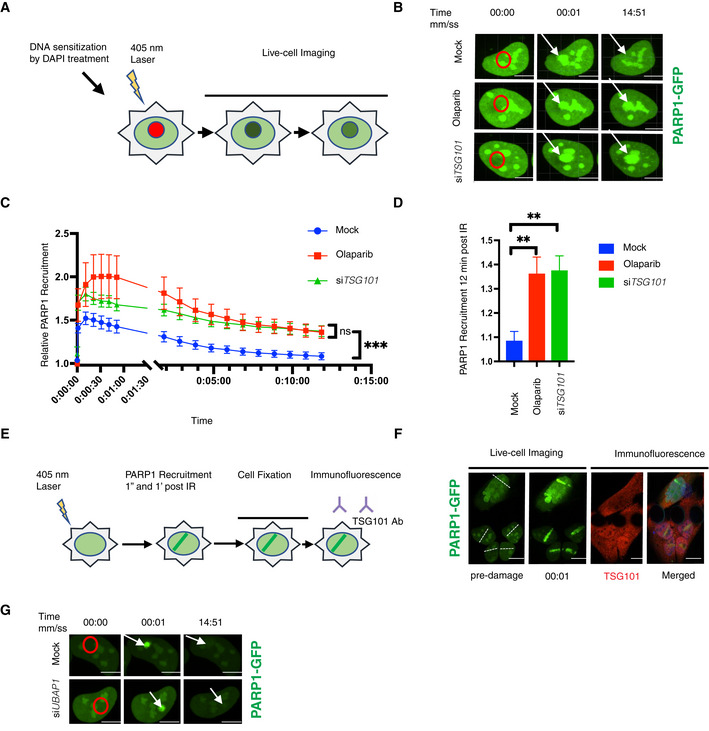
Figure 5. PARP1 is trapped in DNA lesions in the absence of TSG101.

-
ASchematic of the live‐cell PARP1 recruitment assay. U2‐OS cells transfected with GFP‐tagged PARP1 were sensitized with DAPI (10 μg/ml, for 10 min). After 405 nm microirradiation, PARP1 recruitment to and dissociation from the DNA lesion was recorded over time.
-
BRepresentative images of PARP1‐GFP association with laser‐microirradiation sites in untreated (mock), olaparib‐treated (10 μM, 24 h before analysis) or siTSG101‐transfected U2‐OS cells at indicated times postirradiation. Scale bar: 7.5 μm. The image is representative of nine replicates from three biologically independent experiments. Go to Movies [Link], [Link] for further illustration.
-
CKinetics of PARP1‐GFP recruitment and dissociation from DNA lesions were measured at times indicated. Nine nuclei were analyzed for each indicated condition from three biologically independent experiments. The data are shown as mean GFP intensity in the microirradiated area ± SEM, normalized to the mean GFP intensity of corresponding whole nuclei. The conditions were compared with an ordinary one‐way ANOVA (ns, P > 0.05; ***P < 0.001).
-
DRelative PARP1‐GFP recruitment to DNA lesions for each indicated condition at 12 min postirradiation. The conditions were compared with an ordinary one‐way ANOVA (**P < 0.01). Error bars represent mean ± SEM.
-
EScheme of indirect immunofluorescence analysis of DNA damage sites. U2‐OS cells were GFP‐PARP1‐transfected and microirradiated as in (A). Cells were fixed shortly after rapid PARP1 recruitment to the DNA lesions (1 min post‐microirradiation) and stained for TSG101 by indirect immunofluorescence.
-
FIndirect immunofluorescence of TSG101 at indicated times post damage. DNA lesions were generated as in B. Stippled lines indicate the applied laser beam. Recruitment of PARP1 to DNA lesions was recorded from live cells. Cells were fixed at 1 min post‐microirradiation and stained for TSG101. For specificity of the TSG101 staining see Fig EV5A. Scale bar: 10 μm.
-
GRepresentative images of PARP1‐GFP association/dissociation at laser‐microirradiation sites in untreated (mock) or siUBAP1‐transfected U2‐OS cells at indicated times postirradiation. Scale bar: 10 μm. The image is representative of four independent experiments.
