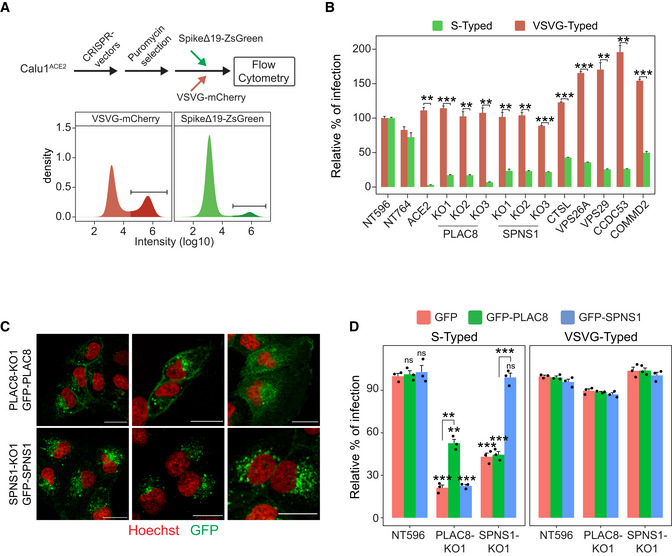
Figure 2. Validation of screen results with pseudotyped lentiviruses.

- Scheme depicting the screen validation strategy (top) and representative density plots (bottom) of flow cytometry data from cells infected with VSVG‐ or Spike‐typed lentivirus. The infected population is labeled with a darker color.
- Susceptibility to infection with Spike‐typed and VSVG‐typed lentiviruses in Calu1ACE2 CRISPR KO cell lines with loss‐of‐function of selected screen candidates. NT596 and NT764 are two nontargeting CRISPR controls. ACE2 are Calu1ACE2 cells transduced with a CRISPR vector against ACE2. Bars represent the average and standard error of the mean (SEM) of the percentage of infected cells in each condition (three biological replicates), normalized to the nontargeting control cell line NT596. The t‐test P‐value between the relative percentage of infection with Spike‐typed and VSVG‐typed for each cell line is indicated.
- Confocal microscopy images of SPNS1‐KO1 and PLAC8‐KO1 Calu1ACE2 cells overexpressing CRISPR‐resistant GFP‐SPNS1 or GFP‐PLAC8, respectively. Scale bar: 20 μm.
- Rescue experiments in PLAC8 and SPNS1 Calu1ACE2 KO cell lines: bar plot showing the average (three biological replicates) and SEM percentage of infection (normalized to NT596 with GFP overexpression) of Spike‐typed and VSVG‐typed lentiviruses in PLAC8‐KO1 and SPNS1‐KO1 cell lines that overexpress CRISPR‐resistant GFP‐PLAC8 or GFP‐SPNS1 constructs. The significance above each bar represents the t‐test P‐value between each condition and the control cell line (NT596 with GFP overexpression).
Data information: ns, P‐value ≥ 0.05, *P‐value < 0.05, **P‐value < 0.01, ***P‐value < 0.001.
Source data are available online for this figure.
