
Figure EV3. SOX2 and SOX9 knock‐down resulted in different transcriptome changes.
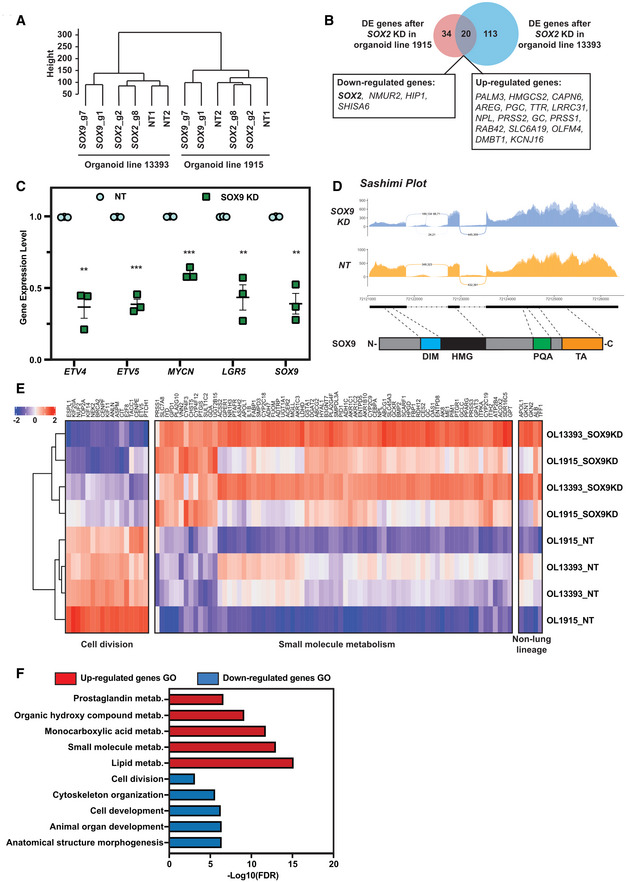
- Unsupervised hierarchical clustering of non‐targeting control, SOX2 knock‐down and SOX9 knock‐down RNA‐Seq results.
- Venn diagram showing minimal overlap of differentially expressed genes after SOX2 knock‐down in two different parental organoid lines. Overlapping DE genes were labelled in boxes.
- qPCR of selected DE genes from SOX9 RNA‐seq data following SOX9 knock‐down in a further 2 independent organoid lines. Cells harvested 5 days after knock‐down. Error bars: mean ± SEM. Statistical analysis was using the two‐tailed paired t‐test. P‐values are reported as follows: **P < 0.01, ***P < 0.001. N = 3 bio‐replicates (Organoid line BRC2174 with two different NT gRNAs and two different SOX9 gRNAs, and Organoid line BRC2136 with 1 NT gRNA and 1 SOX9 gRNA) were used.
- Sashimi plot to visualise splicing junction of NT control and SOX9 KD. Upper panel: Sashimi plot was used to visualise splicing junction information in non‐targeting gRNA control and SOX9 knock‐down groups. Junctional reads between intron #1 and exon #2 were only observed in SOX9 knock‐down groups and not in non‐targeting gRNA control groups. Lower panel: major SOX9 domains in relation to the SOX9 genomic locus. Exon #1 contains DIM and part of the HMG domain. DIM, dimerization domain. HMG, high‐mobility group domain. PQA, proline‐glutamine‐alanine repeats domain. TA, transactivation domain.
- Heatmap of gene expression from representative GO terms: cell division and small molecule metabolism together with gene expression of upregulated non‐lung lineage genes. OL, organoid line.
- Selected GO enrichment in DE genes after SOX9 knock‐down.
Source data are available online for this figure.