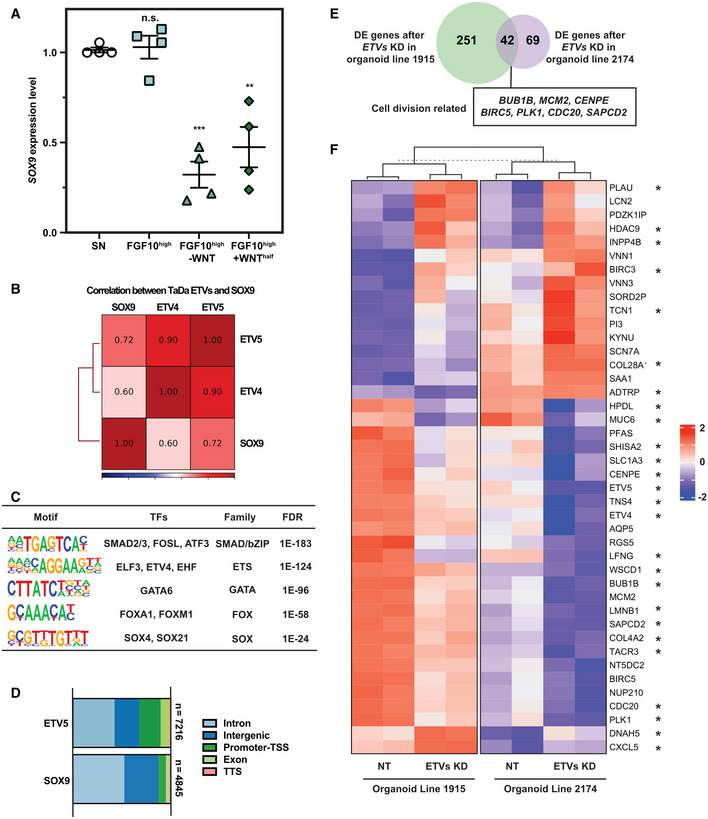
Figure EV5. Identification of direct ETV5 binding targets.

- qRT–PCR showing SOX9 transcription 6 day after FGF10 supplementation (500 ng/ml), or FGF10 supplementation and removal of WNT activators. N = 4 different organoid lines. Error bars: mean ± SEM. Statistical analysis was using the two‐tailed paired t‐test. P‐values are reported as follows: **P < 0.01; ***P < 0.001; n.s. nonsignificant.
- Pearson correlation of SOX9, ETV4 and ETV5 TaDa. ETV4 and ETV5 TaDa exhibited great consistency.
- Motifs enriched in ETV5 TaDa peaks. The ETS binding motif was highly enriched.
- Genomic occupancy annotated features for SOX9 and ETV5 peaks.
- Venn diagram showing overlap of differentially expressed genes after ETV4 and ETV5 double knock‐down in two different parental organoid lines. Overlapping DE genes related to cell division by GO analysis are labelled in the box.
- Heatmap showing expression level of all 42 DE genes after ETV4; ETV5 double knock‐down across different organoid lines. Directly regulated genes are marked by asterisks.
Source data are available online for this figure.
