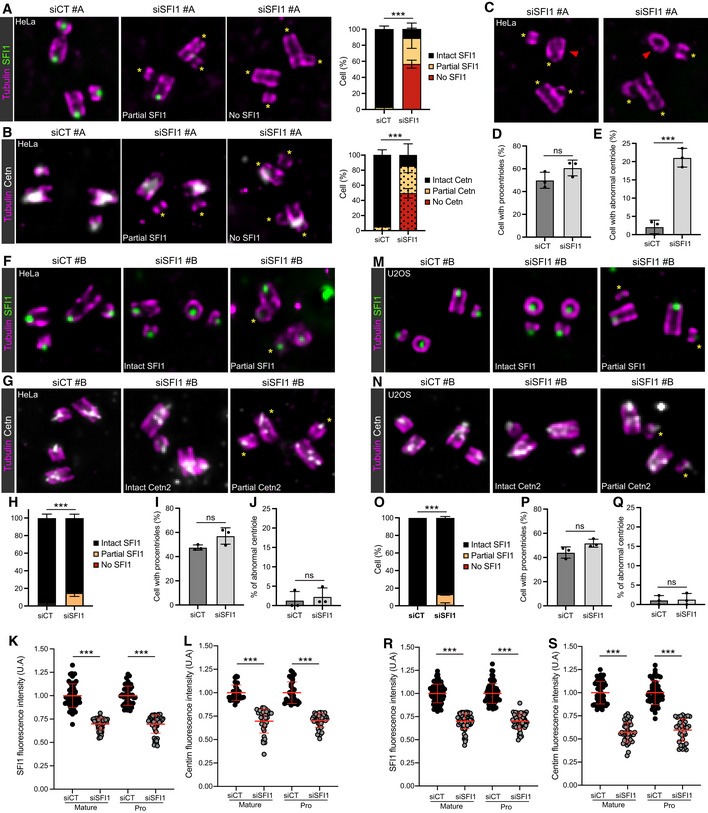
Figure EV3. Characterization of SFI1 depletion in HeLa and U2OS.

-
A, BRepresentative widefield images of expanded centrioles from HeLa cells treated with siCT or siSFI1#A. Cells are stained with Tubulin (magenta) and SFI1 (green, A) or Cetn2/3 (gray, B). Yellow asterisks show the absence of SFI1 (A) and Cetn2/3 (B) at the distal tip of the centriole in siSFI1‐treated cells. Scale bar: 250 nm. Quantifications show the similar loss of SFI1 and Cetn2/3 in SFI1‐depleted cells.
-
CRepresentative widefield images of expanded centrioles from HeLa cells treated siSFI1#A and stained for tubulin (magenta) and SFI1 (green). Note the abnormal shape and structural alteration of the centriole in SFI1‐depleted cells. Yellow asterisks show the absence of SFI1. Red arrowheads indicate abnormal centrioles. Scale bar: 250 nm.
-
DQuantification of the percentage of duplicating centrioles in the indicated conditions.
-
EPercentage of abnormal centrioles in the indicated conditions.
-
F, GRepresentative widefield images of expanded centrioles from HeLa cells treated with siCT or siSFI1#B. Cells are stained with Tubulin (magenta) and SFI1 (green, F) or Cetn2/3 (gray, G). Yellow asterisks show the decreased intensity of SFI1 (F) and Cetn2/3 (G) at the distal tip of the centriole in siSFI1‐treated cells. Scale bar: 250 nm.
-
HQuantification of the efficiency of the siSFI1 shows a mild loss of SFI1 in these conditions.
-
IQuantification of the percentage of duplicating centrioles in the indicated conditions.
-
JPercentage of abnormal centrioles in the indicated conditions.
-
K, LQuantification of the signal intensities of SFI1 (K) and Cetn2/3 (L) in HeLa cells treated with siCT or siSFI1#B showing a marked decrease of both SFI1 and Cetn2/3 at the level of mature and procentriole. However, the complete disappearance of the signal was rarely observed (see panel H).
-
M, NRepresentative widefield images of expanded centrioles from U2OS cells treated with siCT or siSFI1#B. Cells are stained for tubulin (magenta) and SFI1 (green, M) or Cetn2/3 (gray, N). Yellow asterisks show the decreased intensity of SFI1 (M) and Cetn2/3 (N) at the distal tip of the centriole in siSFI1‐treated cells. Scale bar: 250 nm.
-
OQuantification of the efficiency of the siSFI1 shows a mild loss of SFI1 in these conditions.
-
PQuantification of the percentage of duplicating centrioles in the indicated conditions.
-
QPercentage of abnormal centrioles in the indicated conditions.
-
R, SQuantification of the signal intensities of SFI1 (R) and Cetn2/3 (S) in U2OS cells treated with siCT or siSFI1#B showing a notable decrease of both SFI1 and Cetn2/3 at the level of mature and procentriole. However, the complete disappearance of the signal was rarely observed (see panel O).
Data information: Average ± SD, N, statistical analysis: (A) siCT = Intact SFI1: 97.2% ± 3.9, Partial SFI1: 2.8% ± 3.9, No SFI1: 0% ± 0, siSFI1 = Intact SFI1: 11.3% ± 7.6, Partial SFI1: 32.2% ± 12.6, No SFI1: 56.5% ± 5. N = 2 independent experiments (> 50 centrioles per experiment). Two‐way ANOVA (***P < 0.0001). (B) siCT = Intact Cetn2/3: 95% ± 7.1, Partial Cetn2/3: 5% ± 7.1, No Cetn2/3: 0% ± 0, siSFI1 = Intact Cetn2/3: 14.4% ± 14.9, Partial Cetn2/3: 36.2% ± 8.7, No Cetn2/3: 49.4% ± 6.3. N = 2 independent experiments (> 50 centrioles per experiment). Two‐way ANOVA (***P < 0.0001). (D) siCT: 49.9% ± 7, siSFI1#A: 60.7 ± 6.8. N = 3 independent experiments (> 50 cells/experiment). Unpaired t‐test (P = 0.13). (E) siCT: 2.1% ± 1.9, siSFI1#A: 21.1% ± 2.6. N = 3 independent experiments (> 50 cells/experiment). Unpaired t‐test (***P = 0.0005). (H) siCT = Intact SFI1: 97.4% ± 4.4, Partial SFI1: 2.6% ± 4.4, No SFI1: 0% ± 0, siSFI1 = Intact SFI1: 84.9% ± 4.3, Partial SFI1: 15.1% ± 4.3, No SFI1: 0% ± 0. N = 3 independent experiments (> 50 centrioles per experiment). Two‐way ANOVA (***P = 0.0002). (I) siCT: 47.6% ± 2.2, siSFI1#B: 57.1 ± 6.8. N = 3 independent experiments (> 50 centrioles per experiment). Unpaired t‐test (P = 0.08). (J) siCT: 1.2% ± 2.3, siSFI1#B: 2.3 ± 2.3. N = 3 independent experiments (> 50 centrioles per experiment). Unpaired t‐test (P = 0.63). (K) siCT mature: 1.0 ± 0.13, siSFI1#B mature: 0.69 ± 0.06, siCT procentriole: 1.0 ± 0.10, siSFI1#B procentriole: 0.70 ± 0.10. N = 58, 47, 45, 57 for siCT mature, siSFI1#B mature, siCT procentriole and siSFI1#B procentriole respectively, from three independent experiments. One‐way ANOVA (***P < 0.0001 in all conditions). (L) siCT mature: 1.0 ± 0.12, siSFI1#B mature: 0.69 ± 0.13, siCT procentriole: 1.0 ± 0.12, siSFI1#B procentriole: 0.70 ± 0.07. N = 37, 34, 37, 40 for siCT mature, siSFI1#B mature, siCT procentriole and siSFI1#B procentriole respectively, from three independent experiments. One‐way ANOVA (***P < 0.0001 in all conditions). (O) siCT = Intact SFI1: 100% ± 0, Partial SFI1: 0% ± 0, No SFI1: 0% ± 0, siSFI1#B=Intact SFI1: 86.2% ± 1.5, Partial SFI1: 12.5% ± 1.6, No SFI1: 2% ± 2.8. N = 3 independent experiments (> 50 centrioles per experiment). Two‐way ANOVA (***P = 0.0001). (P) siCT: 44.1% ± 4.7, siSFI1#B: 51.8 ± 3.3. N = 3 independent experiments (> 50 centrioles per experiment). Unpaired t‐test (P = 0.08). (Q) siCT: 1.1% ± 1.2, siSFI1#B: 1.3 ± 1.5. N = 3 independent experiments (> 50 centrioles per experiment). Unpaired t‐test (P = 0.86). (R) siCT mature: 1.0 ± 0.10, siSFI1#B mature: 0.70 ± 0.09, siCT procentriole: 1.0 ± 0.11, siSFI1#B procentriole: 0.70 ± 0.08. N = 100, 83, 74, and 57 for siCT mature, siSFI1#B mature, siCT procentriole, and siSFI1#B procentriole respectively, from three independent experiments. One‐way ANOVA (***P < 0.0001 in all conditions). (S) siCT mature: 1.0 ± 0.12, siSFI1#B mature: 0.58 ± 0.11, siCT procentriole: 1.0 ± 0.13, siSFI1#B procentriole: 0.60 ± 0.12. N = 58, 48, 51, 41 for siCT mature, siSFI1#B mature, siCT procentriole, and siSFI1#B procentriole respectively, from three independent experiments. One‐way ANOVA (***P < 0.0001 in all conditions).
