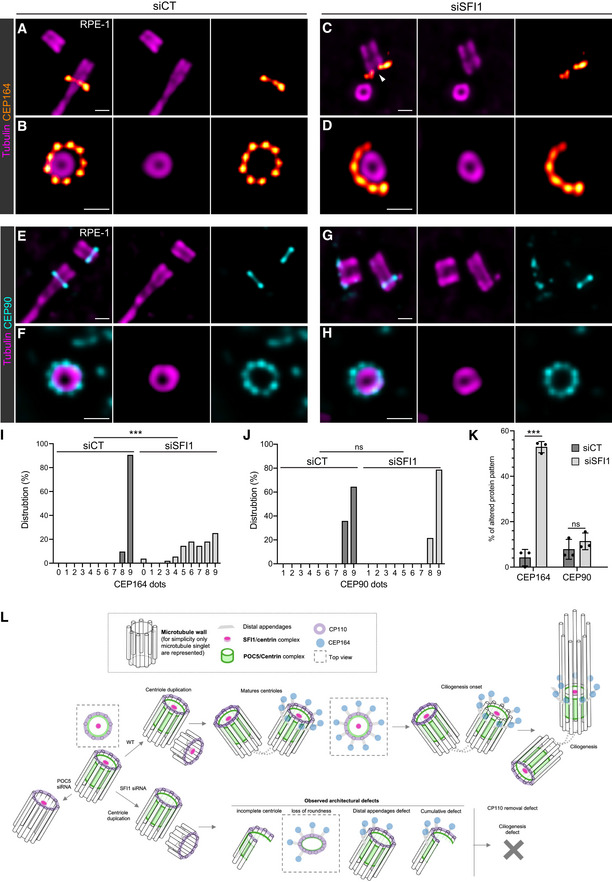
Figure 6. SFI1 depletion impacts the distal appendage CEP164 protein organization.

-
A–DRepresentative widefield images of expanded centrioles during ciliogenesis from siCT (A, B) and siSFI1 (C, D) RPE‐1 treated cells. Cells were stained for α/β‐tubulin (magenta) and CEP164 (red hot). Note the abnormal organization of the distal appendage protein CEP164 in siSFI1‐treated cells. Scale bar: 250 nm.
-
E–HRepresentative widefield images of expanded centrioles during ciliogenesis from siCT (E, F) and siSFI1 (G, H) RPE‐1 treated cells. Cells were stained for α/β‐tubulin (magenta) and CEP90 (cyan). Scale bar: 250 nm.
-
IFrequency distribution of the number of dots per centriole formed by CEP164 in the indicated conditions.
-
JFrequency distribution of the number of dots per centriole formed by CEP90 in the indicated conditions.
-
KPercentage of cells presenting abnormal CEP164 and CEP90 in the indicated conditions.
-
LModel of SFI1/Centrin localization and function at the distal end of human centrioles.
Data information: Average ± SD, N, statistical analysis: (I) siCT = 0–7 dots: 0%, 8 dots: 9.5%, 9 dots: 90.5%. siSFI1 = 0 dot: 3.6%, 1–2 dots: 0%, 3 dots: 1.8%, 4 dots: 5.4%, 5 dots: 14.3%, 6 dots: 17.9%, 7 dots: 14.3%, 8 dots: 17.9%, 9 dots: 25. N = 21 and 56 centrioles for siCT and siSFI1 respectively from three independent experiments. Mann–Whitney test (***P < 0.0001). (J) siCT = 0–7 dots: 0%, 8 dots: 35.7%, 9 dots: 64.3%. siSFI1 = 0–7 dots: 0%, 8 dots: 21.4%, 9 dots: 78.6%. N = 14 and 28 centrioles for siCT and siSFI1 respectively from three independent experiments. Mann–Whitney test (P = 0.459). (K) siCT = CEP164: 4.2% ± 3.6, CEP90: 7.8% ± 4.4. siSFI1 = CEP164: 52.8% ± 2.5, CEP90: 11.4% ± 3.7. N = 3 independent experiments (> 50 centrioles/experiments). Two‐way ANOVA followed by Sidak's multiple comparison (CEP164 siCT vs. siSFI1, ***P < 0.0001; CEP90 siCT vs. siSFI1, P = 0.607).
