Figure 2.
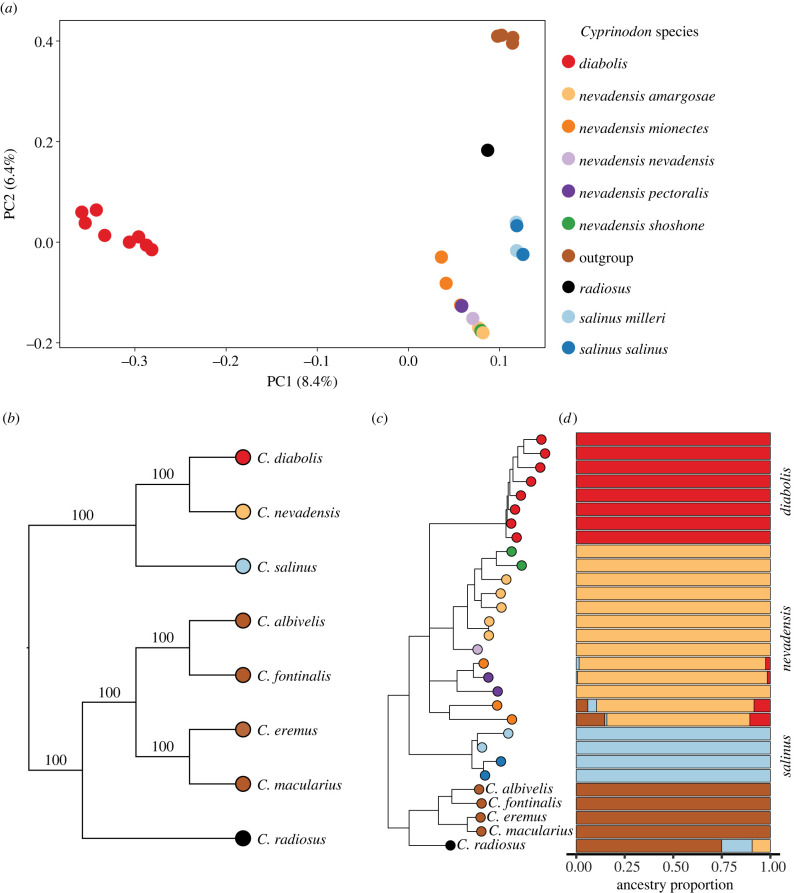
Population structure and evolutionary relationships among desert pupfishes. (a) Principal component analysis of desert pupfishes revealing substantial population structure among species and populations. (b) Species tree estimated by SVDquartets; nonparametric bootstrap support values indicate the percentage of bootstrap replicates supporting monophyly for each clade. (c) Maximum-likelihood tree of all 30 samples estimated by IQ-TREE. Two internal branches were collapsed due to low support (ultrafast bootstrap < 95%, SH-aLRT < 80%); all other branch support was unequivocal (UFboot = 100%, SH-aLRT = 100%). (d) Ancestry proportions across individuals in Death Valley NP, Ash Meadows NWR and outgroup desert pupfishes (C. albivelis, C. eremus, C. fontinalis, C. macularius, C. radiosus) estimated from a LD-pruned SNP dataset in ADMIXTURE with k = 4. Colours in PCA, trees and ADMIXTURE designate individuals from different species or populations and correspond to the shared figure legend in (a). (Online version in colour.)

