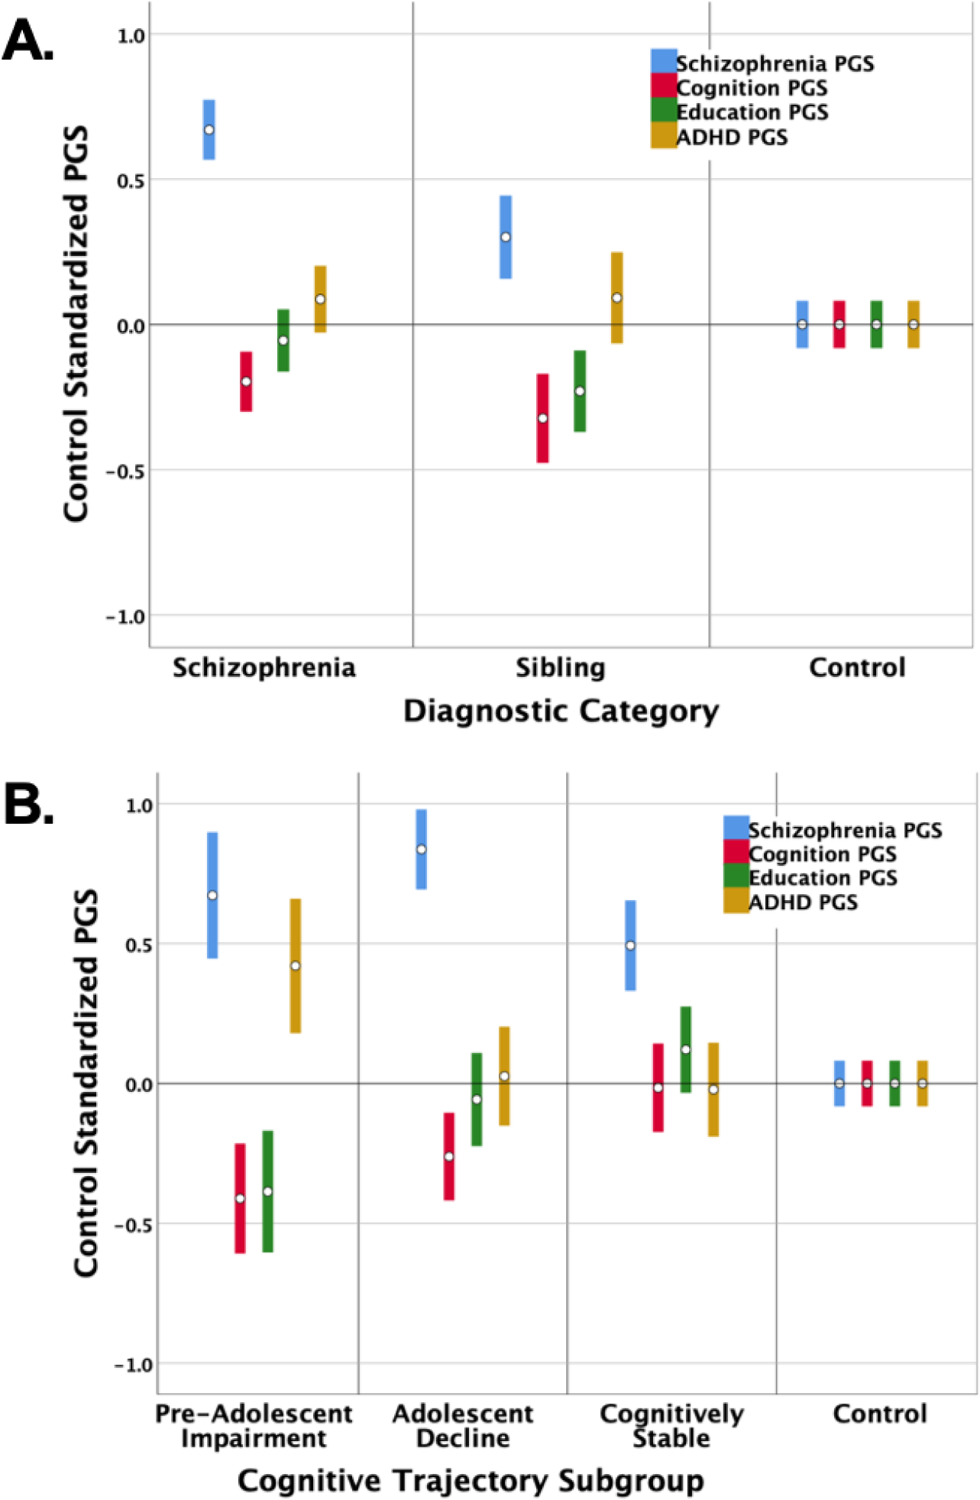
Figure 3. Polygenic scores (PGSs) by diagnostic group (total N=1631) and by schizophrenia cognitive trajectory subgroup (N=540).

Bars represent 95% confidence intervals. Statistical details are in Tables 1 and 2. The figures depict the profiles of PGSs for the main diagnostic categories in our study (Panel A) and the schizophrenia cognitive trajectory subgroups (Panel B). PGSs were derived in our samples for schizophrenia (blue), cognition (red), educational attainment (green), and ADHD (gold). It warrants emphasis that for schizophrenia and ADHD PGS, higher standardized scores indicate higher disorder risk. For cognition and education PGSs, lower standardized scores predict worse cognitive and academic performance. All PGSs were adjusted to account for age, sex, and population stratification, and then standardized. We used control means and SD’s to standardize the PGSs so that controls serve as the reference for differences in PGSs across diagnostic categories and across cognitive trajectory subgroups.
