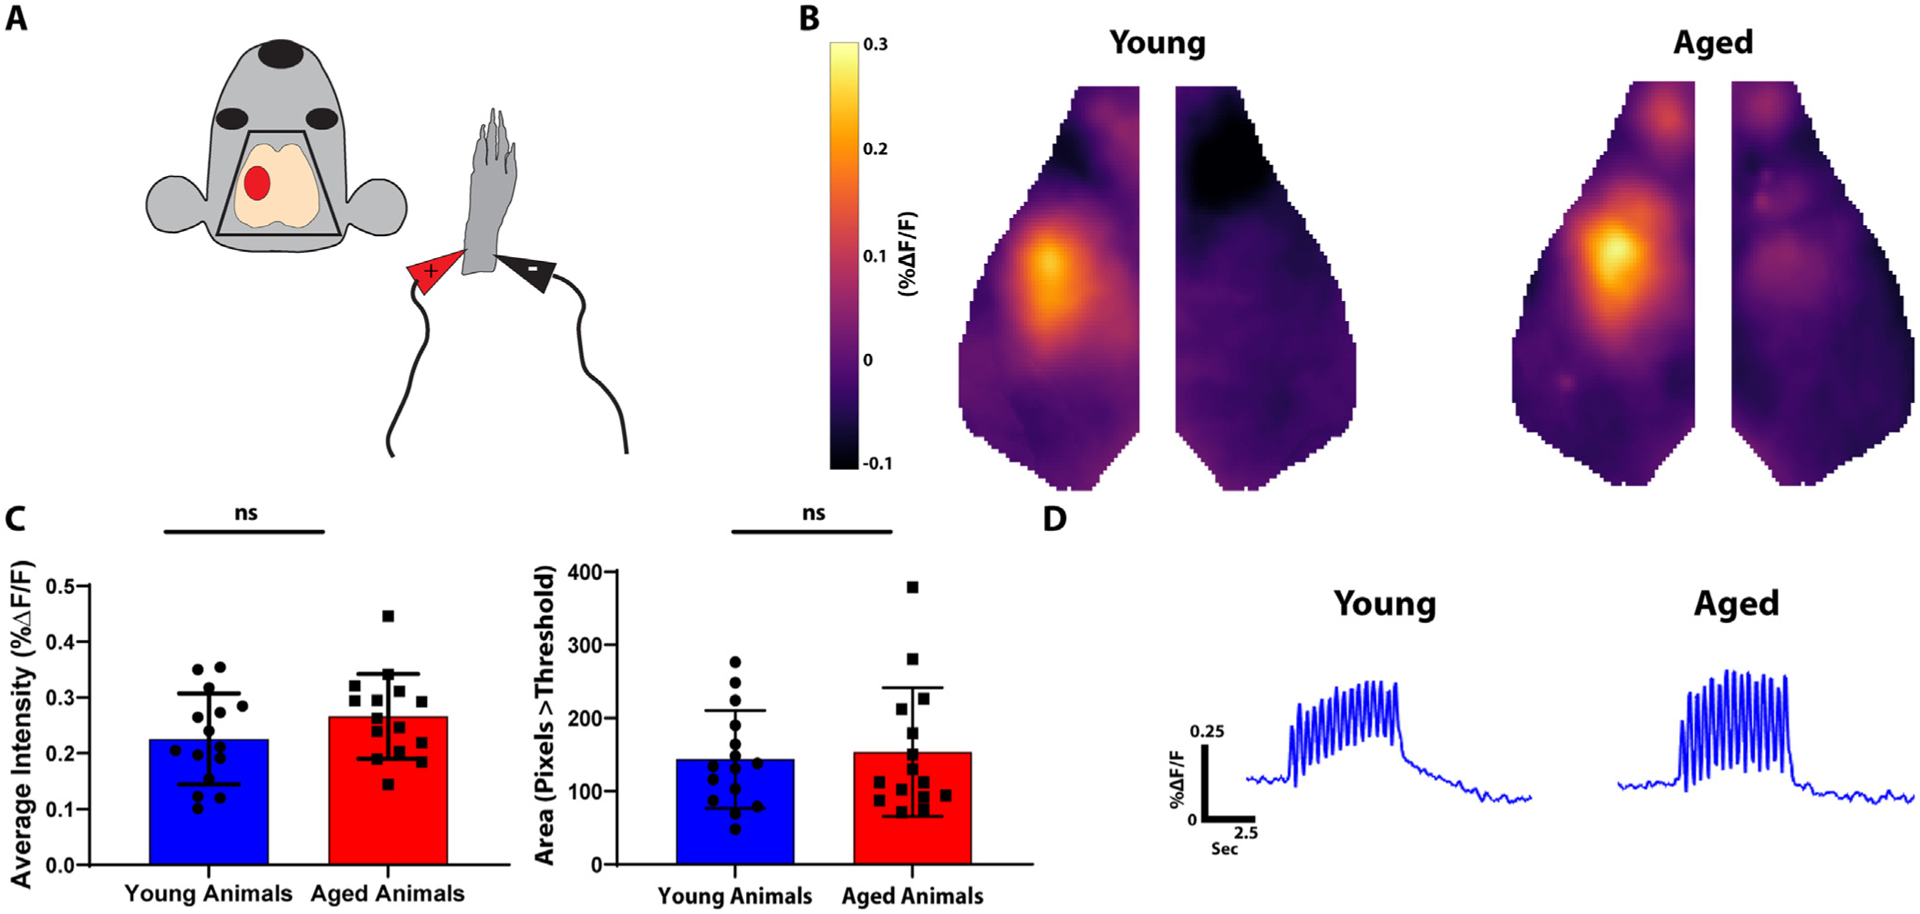
Fig. 2. Young and Aged Mice have Similar Patterns of Evoked Somatosensory Cortex Activity.

A. Diagram of experimental paradigm. The right forepaw was stimulated with mild electrical pulsations and contralateral somatosensory cortex activity was imaged (red oval). B. Average somatosensory activation in young (left) and aged (right) animals. C. Quantification of evoked somatosensory activity. The left graph represents average intensity within a somatosensory ROI. The right graph represents total area of activation as measured by pixels greater than threshold. D. Averaged fluorescence amplitude curves over time within a somatosensory ROI in young (left) vs. aged (right) animals.
