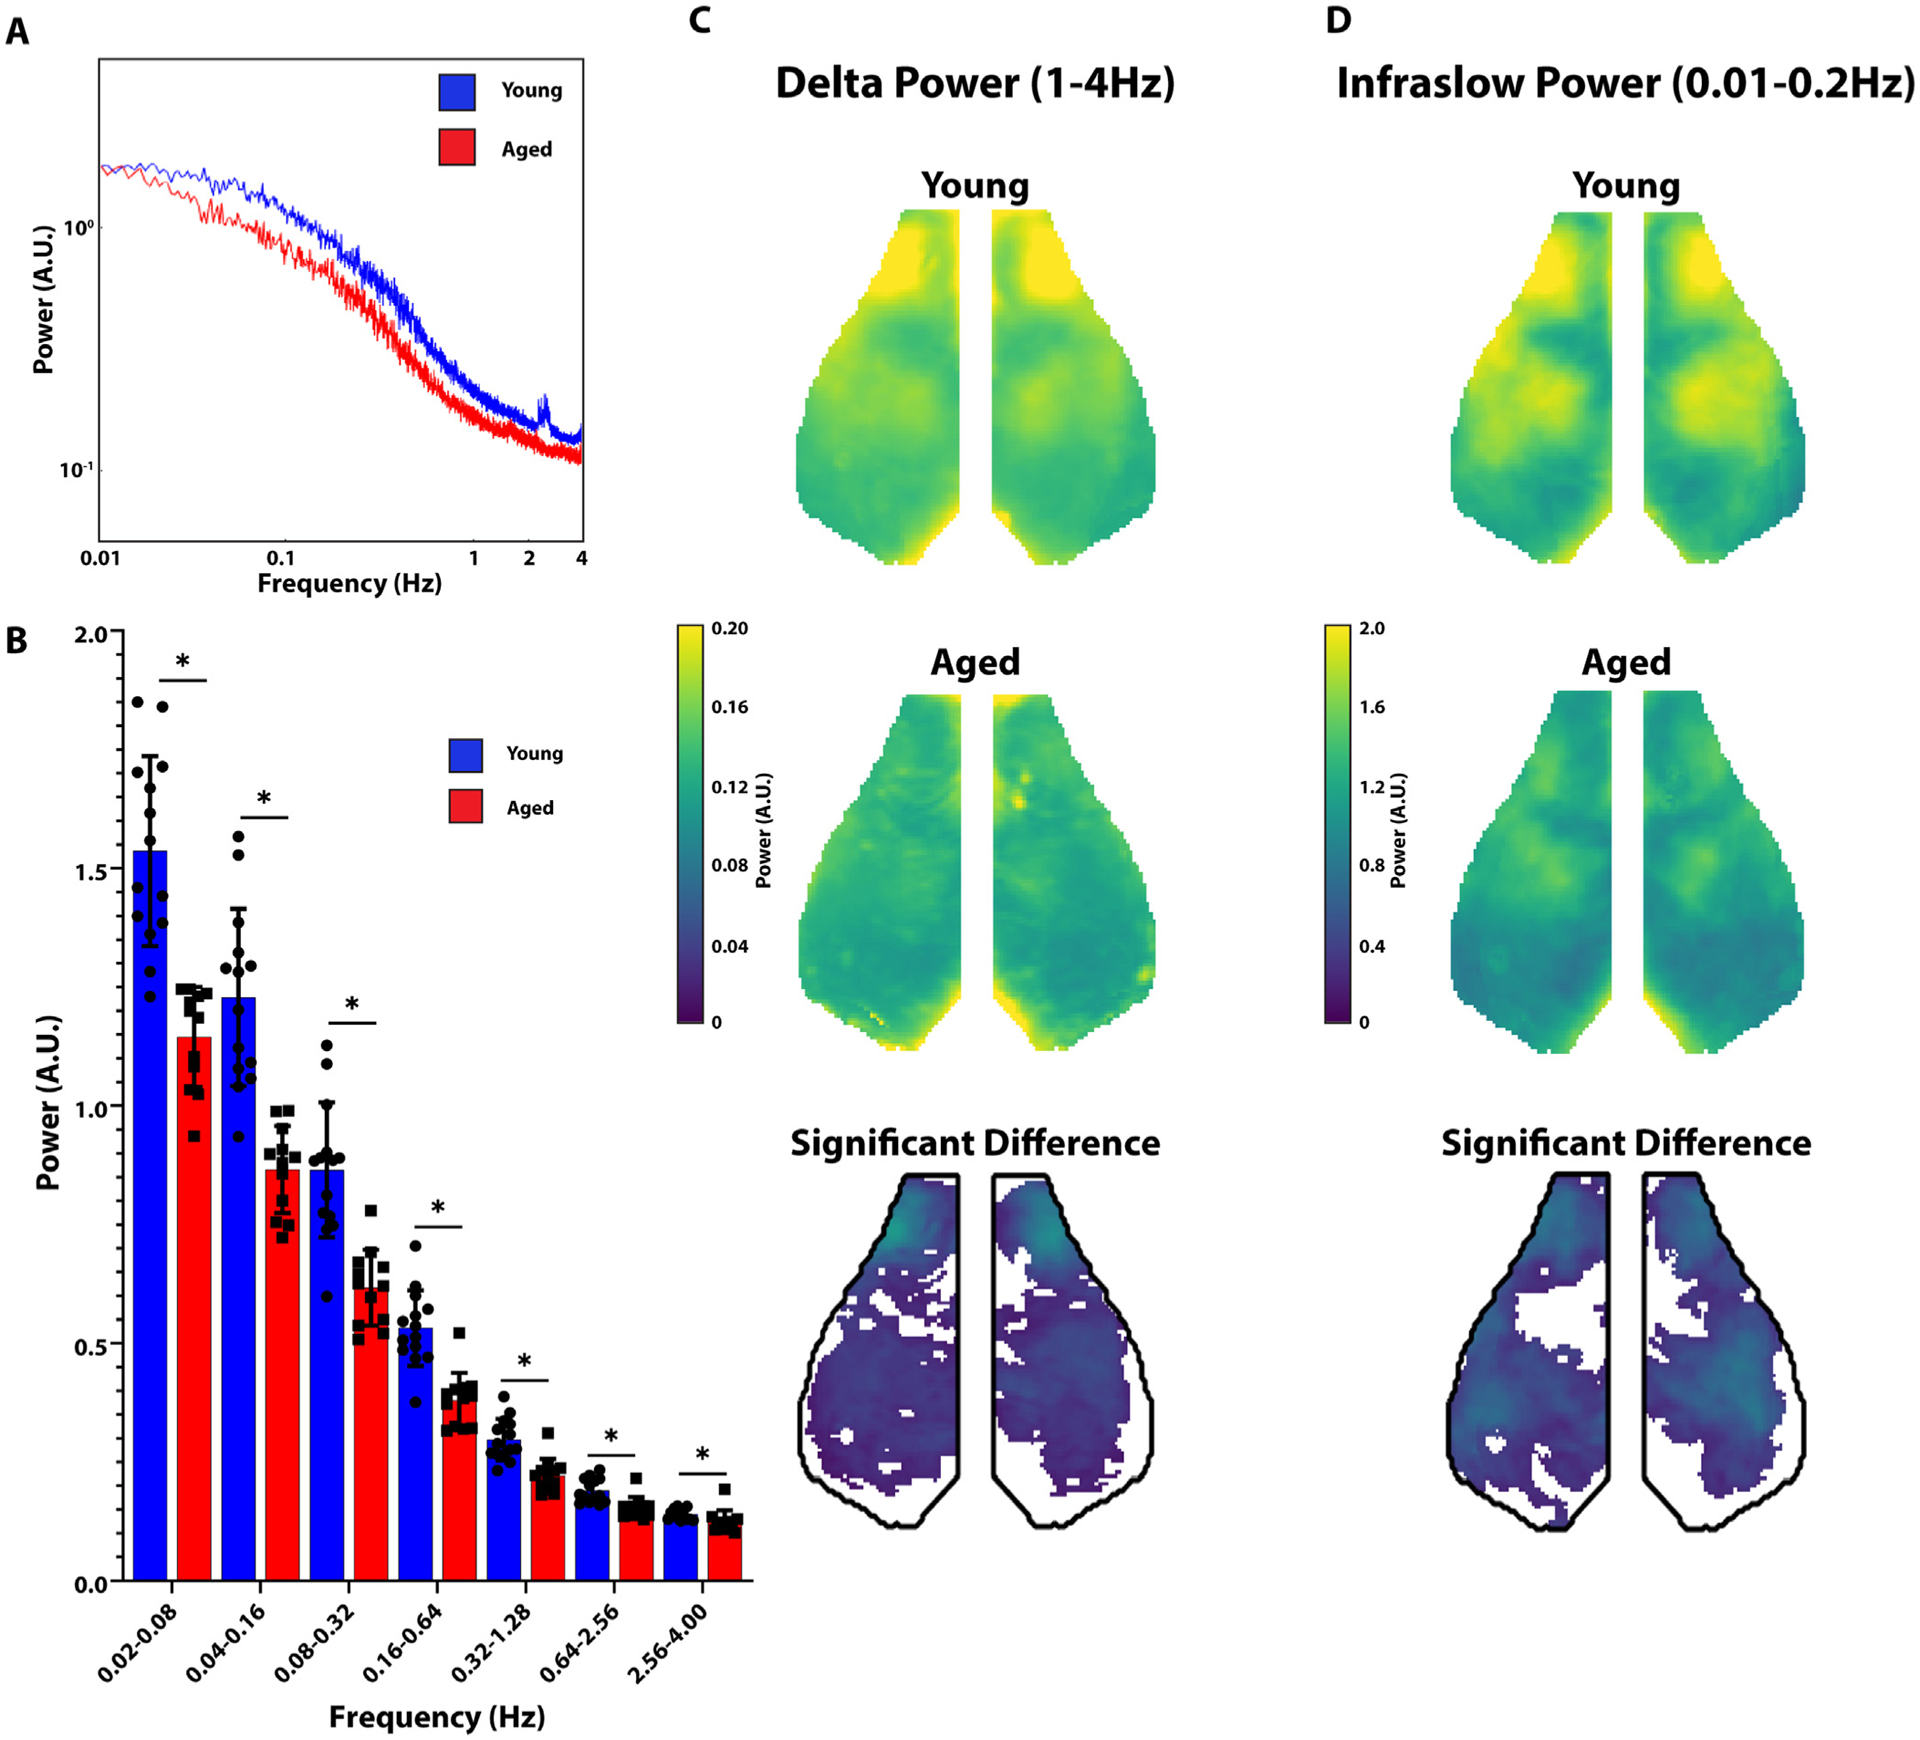
Fig. 3. Aged Animals have Significantly Reduced Resting State Power.

A. Power spectral density is shown in arbitrary units (A.U.). Graph of Power as a function of frequency in aged (red) vs young (blue) animals. B. Whole-cortex power divided into octaves in young (blue) vs. aged (red) animals. Young animals had significantly greater whole-cortex power at all measured frequencies. C. Group averaged maps of whole-cortex delta (left) power in young animals (top row) and aged animals (middle row). The bottom row represents the difference between young and aged groups (young-aged) thresholded for significance. D. Same as C but in the infraslow band.
