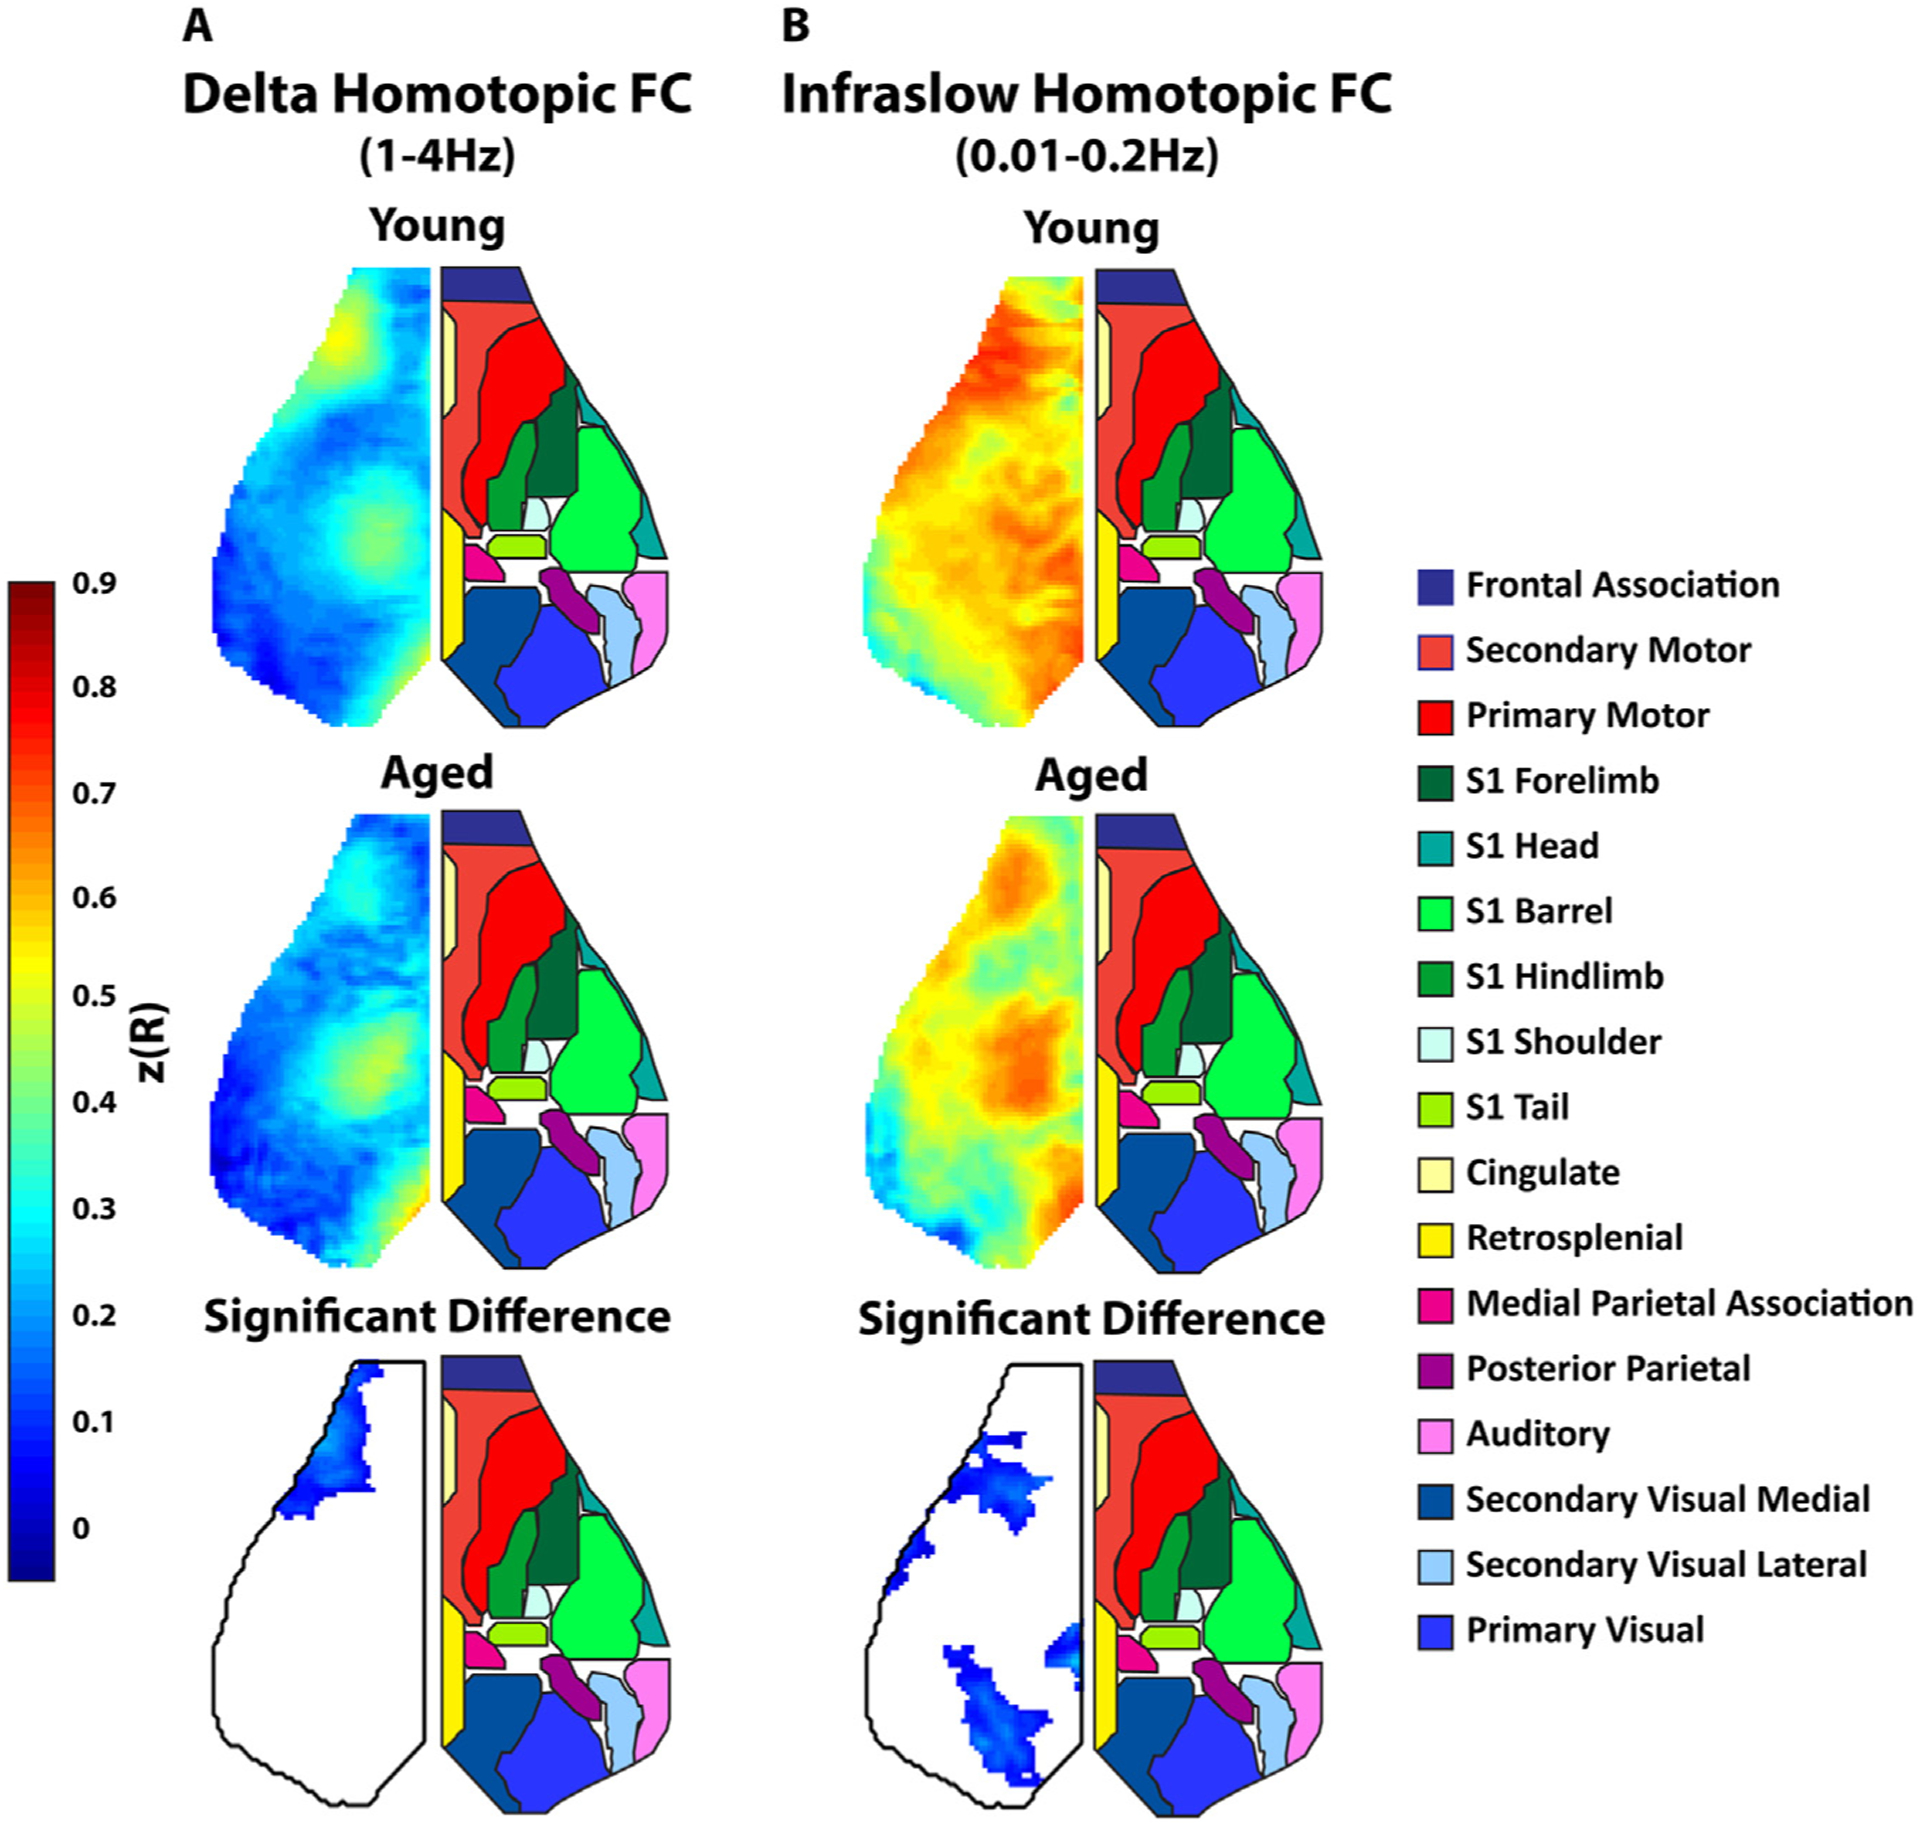
Fig. 5. Aged Animals have Significantly Reduced Homotopic Functional Connectivity.

A. Group averaged maps of whole-cortex homotopic FC (correlation between each pixel and its mirror pixel) in the delta (1–4 Hz) frequency band. Top map is the average homotopic FC in young animals. The middle map is average homotopic FC in aged animals. The bottom map is difference between the average young and aged maps (young-aged) thresholded for significance. Since the maps were symmetric, the left side of the cortex is shown and the right side shows a map of approximate cortical networks based on the Paxinos atlas. B. Similar group average maps as A but in the infraslow band.
