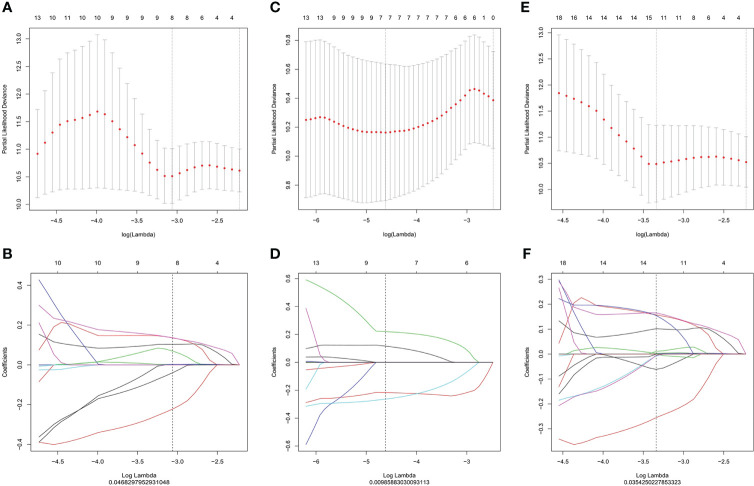
Figure 2.
LASSO regression for radiomic feature selection in Ktrans (A, B), Ve images (C, D) and Ktrans +Ve images (E, F). (A, C, E) Selection of the optimal value of lambda (λ). Tuning log(λ) selection in the LASSO model used to perform 10-fold cross-validation via the minimum criteria. The y-axis indicates the partial likelihood deviance, while the lower x-axis indicates the log (λ) and the upper x-axis represents the average number of predictors. (B), (D), (F): Each colored curve represents the trajectory of the change of an independent variable. Lambda values of 0.04682979 (B), 0.00985883 (D), and 0.03542502 (F) were selected as the optimal values, respectively. LASSO, Least absolute shrinkage and selection operator.

