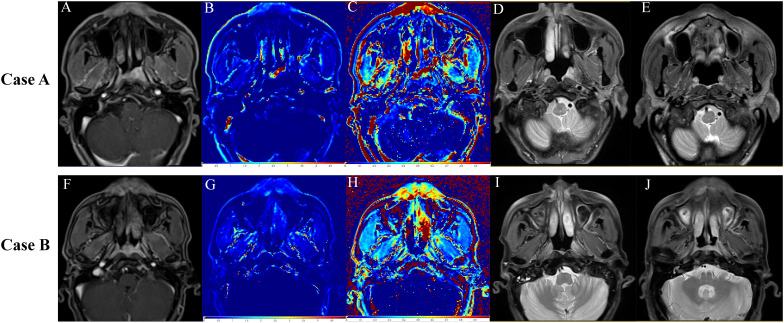
Figure 5.
Representative images from three different time points during the follow-up period. The upper row shows images from Case A (T3N2M0) treated with nimotuzumab. (A–C) Baseline DCE-MR images. (A) Slice image. (B) ktrans image. (C) ve image. (D) T2-weighted image at 3 months of follow-up showing shrinkage of the primary tumor lesion. (E) T2-weighted image at 23 months of follow-up showing complete regression of the primary tumor. The lower row shows images from Case B (T3N2M0) not treated with nimotuzumab. (F–H) Baseline DCE-MR images. (F) Slice image, (G) ktrans image. (H) ve image. (I) T2-weighted image at 3 months of follow-up showing shrinkage of the primary tumor lesion. (J) T2-weighted image at 12 months of follow-up showing the first recurrence of the disease.

