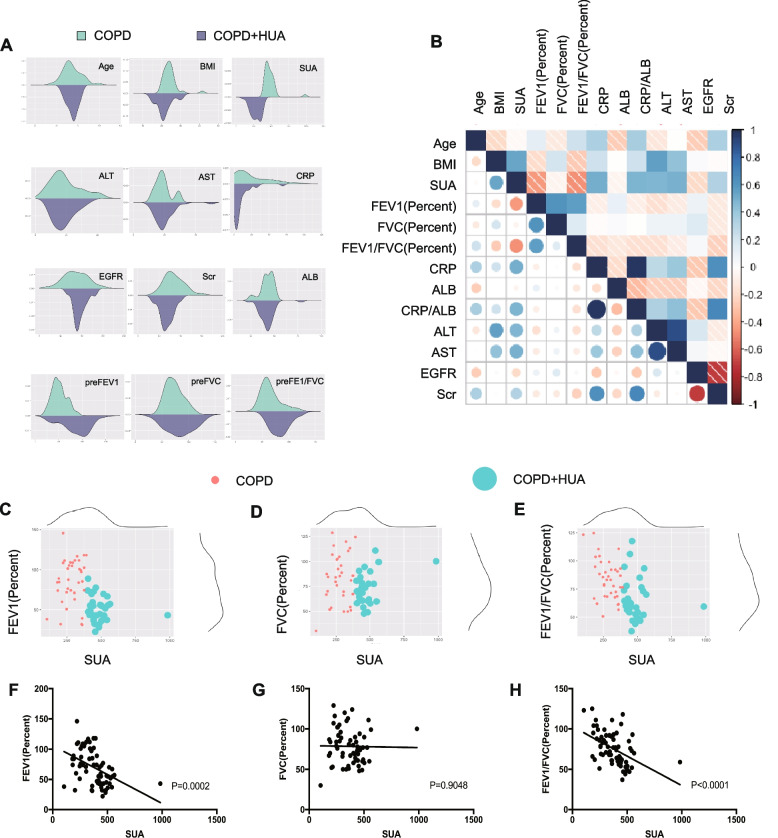
Fig. 2.
Clinical features of the included COPD patients. A Density distribution showing the difference of clinical indicators between COPD patients with or without HUA groups. B Correlation coefficient matrix indicating the correlation between clinical parameters including baseline features, blood biochemistry and lung function test among COPD patients. C-H Scatter diagram and linear regression showing the level of serum uric acid and lung function test FEV1percent (C, F), FVC percent (D, G) and FEV1-FVCpercent (E, H). Abbreviation: COPD, chronic obstruction pulmonary disease; HUA, hyperuricemia; SUA, serum uric acid; BMI, body mass index; FEV1, forced expiratory volume in one second; FVC, forced vital capacity; CRP, C-reactive protein; ALT, alanine transaminase; AST, aspartate transaminase; ALB, albumin; EGFR, estimated Glomerular Filtration Rate; SCR, serum creatinine

