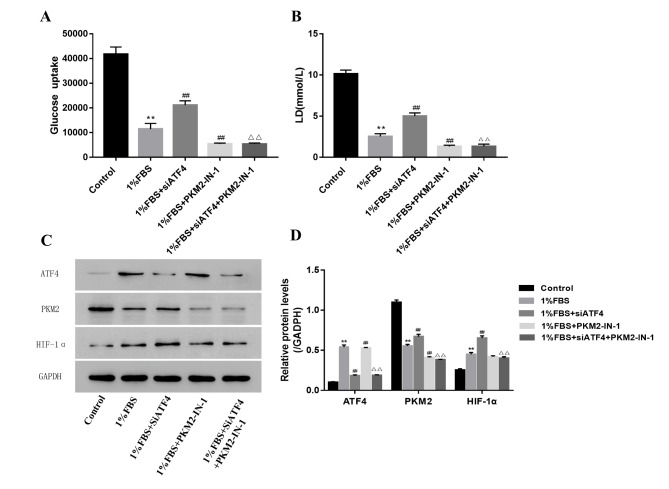
Fig. 6.
PKM2 inhibition can reduce NP cell’s glucose uptake and lactic acid level induced by ATF4 silence under the nutritional deficiency condition
(A) The NP cell’s glucose uptake level induced by ATF4 silence or PKM2 inhibition under the nutritional deficiency condition (B) The NP cell’s lactic acid level induced by ATF4 silence or PKM2 inhibition under the nutritional deficiency condition (C) The glucolysis status detected by western blot induced by ATF4 silence or PKM2 inhibition under the nutritional deficiency condition (Group A, B, C, D, E denotes the 10%FBS, 1%FBS, 1%FBS with siATF4, 1%FBS with PKM2-IN-1, 1%FBS + siATF4 + PKM2-IN-1 group respectively) (D) The quantity the protein reflected glucolysis status as showed in C. Data are mean ± s.d. The percentage calculation in each tissue were measured at least 1000 cells each sample. Statistical significance was determined by one-way ANOVA and Student’s t-test. **, ##, △△ P < .001

