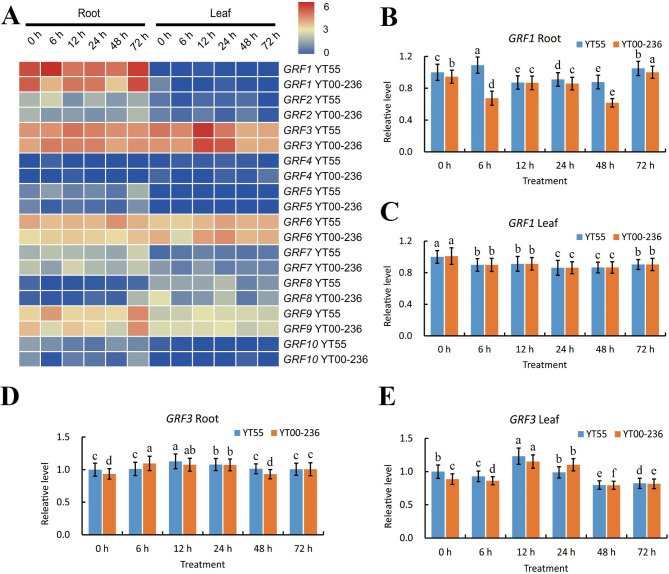
Fig. 6.
The expression pattern of GRF genes in Saccharum hybrid YT55 and YT00-236 based on log2-transformed FPKM values (A) under low-nitrogen stress conditions and verification of GRF1 and GRF3 expressions in root and leaf by RT-qPCR (B, C, D, and E). Seedlings of TY55 and TY00-236 were subjected to a nitrogen treatment of 100 mM, and samples were taken at 0, 6, 12, 24, 48, and 72 h after the treatment. The expression at 0 h was set to 1.0. Values were mean ± SD of three replicates. Bars with different letters were significantly different at the p < 0.05 level

