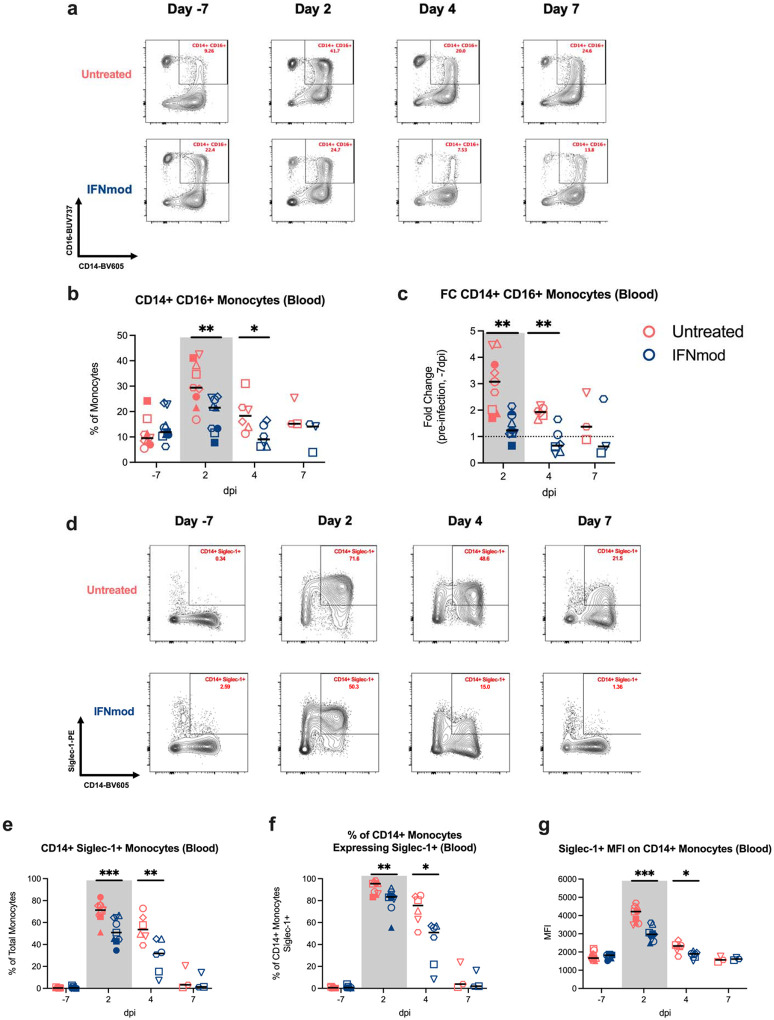
Fig. 3. IFNmod-treated RMs had lower frequencies of CD14+CD16+ monocytes and expression of Siglec-1 compared to untreated RMs.
(a) Representative staining of classical (CD14+CD16-), non-classical (CD14-CD16+), and inflammatory (CD14+CD16+) monocytes in peripheral blood throughout the course of infection. (b-c) Frequency and fold change relative to pre-infection baseline (−7dpi) of inflammatory (CD14+CD16+) monocytes in peripheral blood. (d-e) Representative staining and frequency of Siglec-1+ CD14+ monocytes in peripheral blood. (f) Frequency of CD14+ monocytes that were Siglec-1+ in peripheral blood. (g) MFI of Siglec-1 on CD14+ monocytes in peripheral blood. Untreated animals are depicted in red and IFNmod treated animals are depicted in blue. Black lines represent the median frequency or fold change in animals from each respective treatment group. Gray-shaded boxes indicate that timepoint occurred during IFNmod treatment. Statistical analyses were performed using non-parametric Mann-Whitney tests. * p-value < 0.05, ** p-value < 0.01

