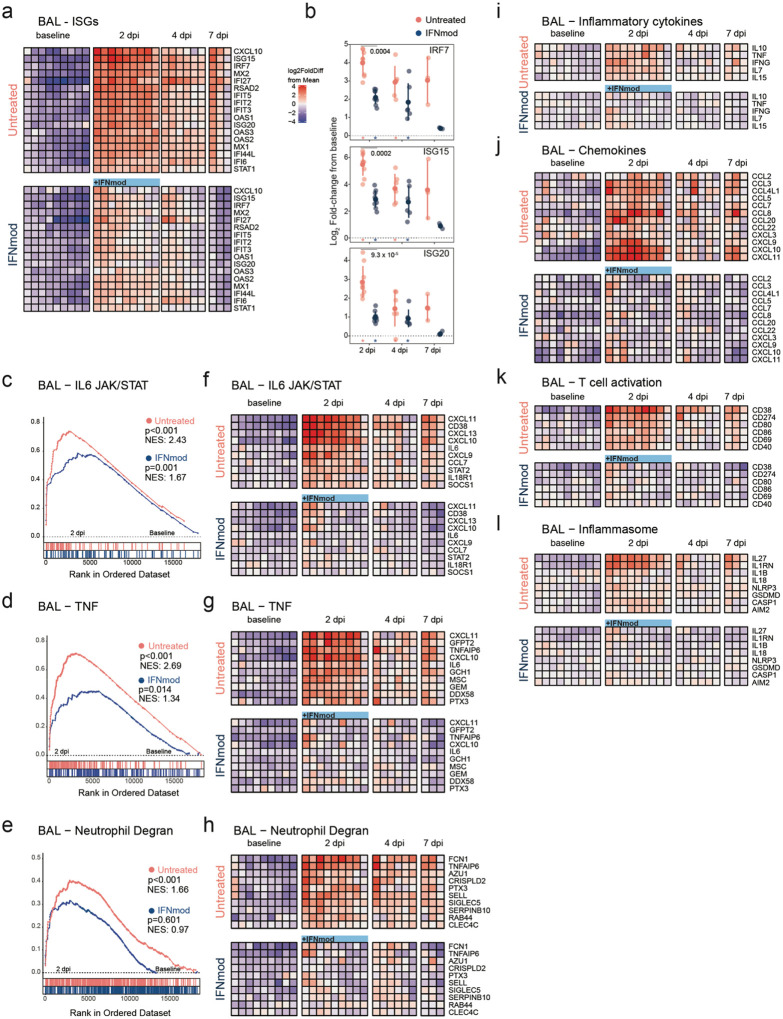
Fig. 4. IFNmod treatment suppresses gene expression of ISGs, inflammation and neutrophil degranulation in the BAL of SARS-CoV-2 infected NHPs.
Bulk RNA-Seq profiles of BAL cell suspensions obtained at −7 dpi (n = 9 for each arm), 2 dpi (n = 9 per arm), 4 dpi (n = 6 per arm), and 7 dpi (n = 3 per arm). (a) Heatmap of longitudinal gene expression in BAL prior to and following SARS-CoV-2 infection for the ISG gene panel. The color scale indicates log2 expression relative to the mean of all samples. Samples obtained while the animals were receiving IFNmod administration are depicted by a blue bar. (b) Distribution of log2 fold-changes of select ISGs relative to baseline. Filled dots represent the mean, and lighter dots are individual data points. Asterisks indicate statistical significance (padj < 0.05) of gene expression relative to baseline within treatment groups; black horizontal bars indicate p-values of direct contrasts of the gene expression between groups at time-points (i.e. IFNmod vs Untreated). (c-e) GSEA enrichment plots depicting pairwise comparison of gene expression of 2 dpi samples vs −7 dpi samples within treatment groups. The untreated group is depicted by red symbols, and data for the IFNmod treated group is shown in blue. The top-scoring (i.e. leading edge) genes are indicated by solid dots. The hash plot under GSEA curves indicate individual genes and their rank in the dataset. Left-leaning curves (i.e. positive enrichment scores) indicate enrichment, or higher expression, of pathways at 2 dpi, right-leaning curves (negative enrichment scores) indicate higher expression at −7 dpi. Sigmoidal curves indicate a lack of enrichment, i.e. equivalent expression between the groups being compared. The normalized enrichment scores and nominal p-values testing the significance of each comparison are indicated. Genesets were obtained from the MSIGDB (Hallmark and Canonical Pathways) database. (f-h) Heatmaps of longitudinal gene expression after SARS-CoV-2. Genes plotted are the top 10 genes in the leading edge of geneset enrichment analysis calculated in panels c-e for each pathway in the Untreated 2 dpi vs −7 dpi comparison. (i-l) Longitudinal gene expression for selected DEGs in immune signaling pathways. The expression scale is depicted in the top right of panel A.

