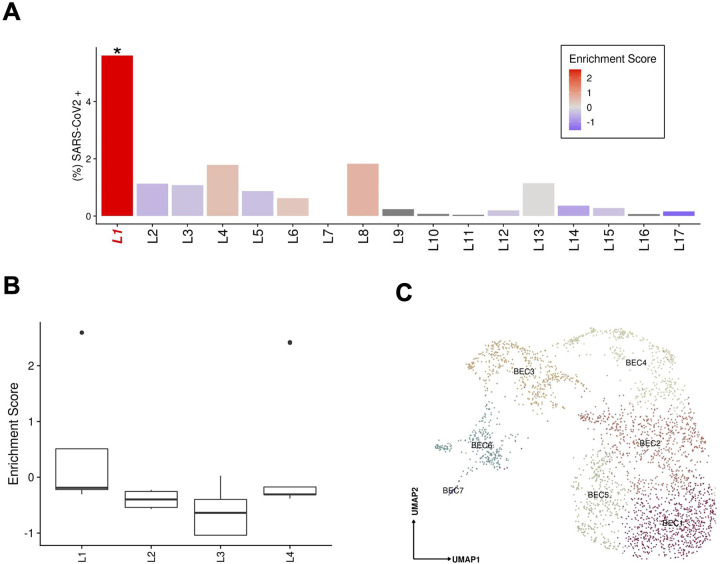
Figure 4:
(A) Abundance of SARS-CoV-2 RNA+ nuclei in the snRNAseq data for each donor. The bars are colored by the scaled viral enrichment score estimated per donor. Only donor L1 has a significant viral enrichment score (* FDR < 0.01; Viral enrichment test). (B) Distribution of the NanoString GeoMx DSP SARS-CoV-2 probe enrichment score across donors. Donor L1 has a significantly higher enrichment score (FDR = 0.037, t-test) compared to the rest of the donors (L2–4). (C) Uniform manifold approximation and projection (UMAP) for Biliary epithelial cells (BEC1 n=736; BEC2 n=687; BEC3 n=457; BEC4 n=373; BEC5 n=371; BEC6 n=281; BEC7 n=27).

