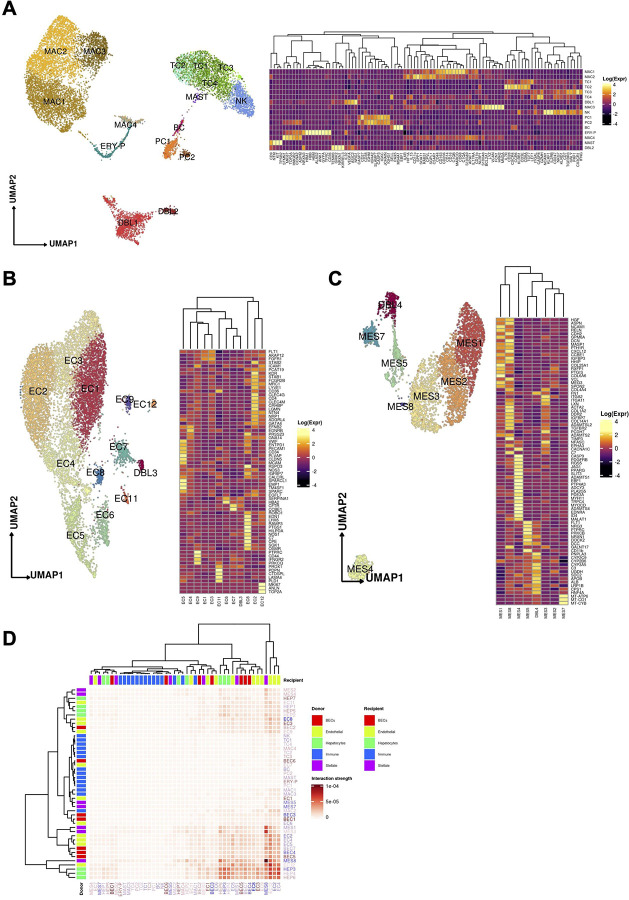
Figure 5:
(A) Uniform manifold approximation and projection (UMAP) for the (A) Immune / blood, (B) Endothelial cell, and (C) Mesenchymal cell compartments ((A) Immune: MAC1 n = 2,798, MAC2 n = 2,601, TC1 n = 1,522, TC2 n = 388, TC3 n = 327, TC4 n = 29, DBL1 n = 1,331, MAC3 n = 1,038, NK n = 857, PC1 n = 397, PC2 n = 124, BC n = 124, ERY-P n = 359 MAC4 n = 222, MAST n = 36 DBL2 n = 193; (B) Endothelial: EC1 n = 2,338, EC2 n = 2,247, EC3 n = 1,563, EC4 n = 1,117, EC5, n = 795, EC6 n = 379, EC7 n = 328, EC8 n = 166, EC9 n = 116, DBL3 n = 91, EC11 n = 73, EC12 n = 65, (C) Mesenchymal: MES1 n=1,223, MES2 n=1,065, MES3 n=1,040, MES4 n=374, MES5 n=328, MES6 n=312, MES7 n=275, MES8 n=30). Heatmaps capturing the expression of marker genes across the 3 distinct major compartments are displayed. (D) Heatmap portraying the cell-cell communications between the cell populations. The color gradient indicates the strength of interaction between any two cell groups. Recipient/Donor cell-type color is portrayed in a blue (healthy) to red (COVID-19) gradient, relevant to the cell composition fold-change differences between healthy and COVID-19 liver samples.

