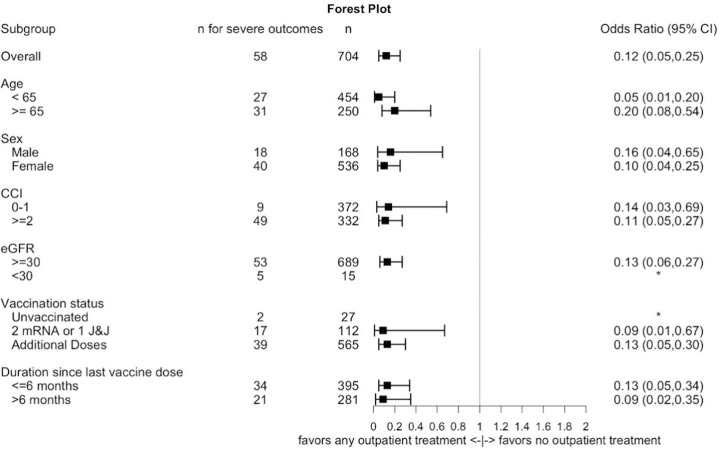
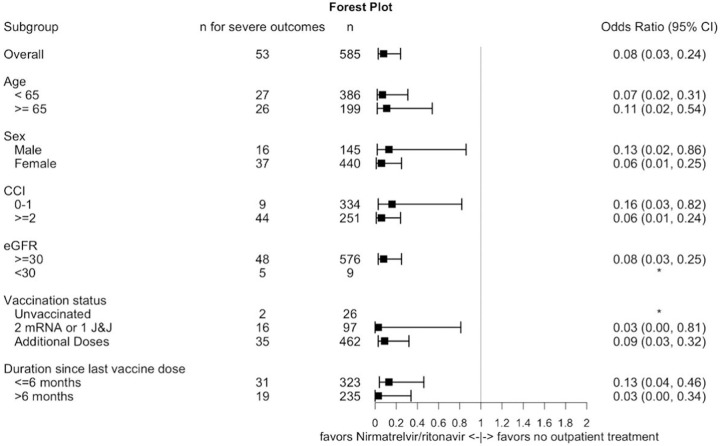
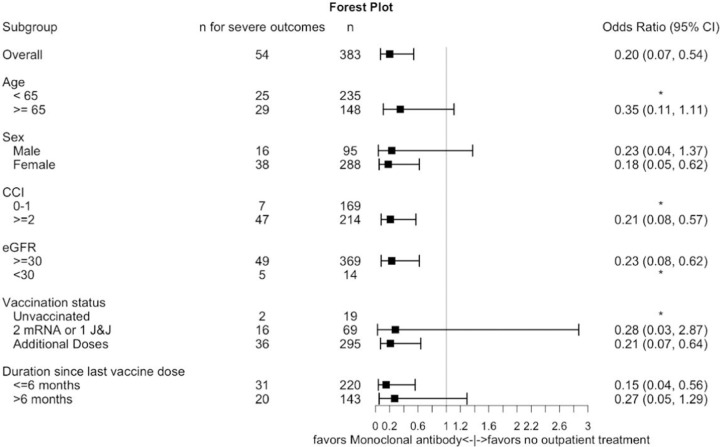
Figure 2.
Forest plots of subgroups for odds of severe COVID-19 (hospitalization or death) comparing A) any vs. no outpatient treatment, B) nirmatrelvir/ritonavir vs. no outpatient treatment, and C) monoclonal antibodies vs. no outpatient treatment. Adjusted for continuous age, continuous Charlson Comorbidity Index, continuous estimated glomerular filtration rate, and race. *Model did not converge due to few outcomes.


