
FIGURE 4.
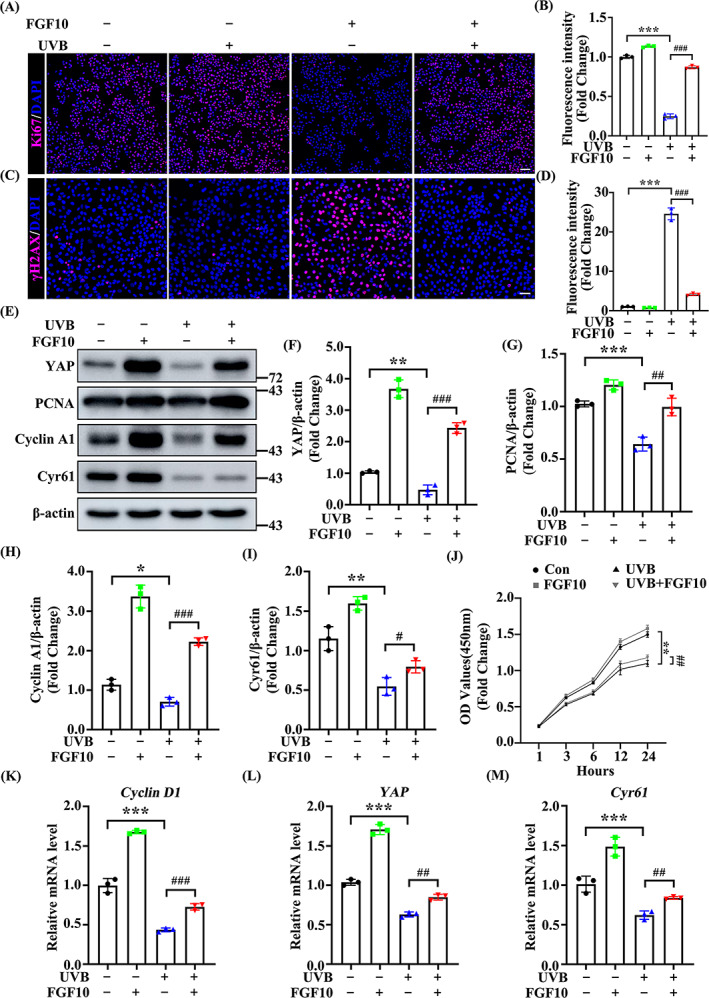
FGF10 protects against UVB‐induced cell damage via a YAP‐dependent pathway. (A) Immunofluorescence staining of Ki‐67 (Red) in untreated or UVB treated HaCaT with or without FGF10. Nuclei were stained with DAPI (Blue) (n = 3). Scale bars = 100 μm. (B) Quantification the percentage of Ki‐67‐positive cells from (A). (C) Immunofluorescence staining of γ‐H2AX (Red) in untreated or UVB treated HaCaT with or without FGF10. Nuclei were stained with DAPI (Blue) (n = 3). Scale bars = 50 μm. (D) Quantification the percentage of γ‐H2AX‐positive cells from (C). (E) The protein expression of YAP, PCNA, Cyclin A1 and Cyr61 were measured by immunoblotting assay in untreated and UVB treated with or without FGF10. β‐actin was used as a loading control (n = 3). (F–I) Quantification of YAP, PCNA, Cyclin A1 and Cyr61 protein levels in (E). (J) CCK8 assays were used to estimate the cell proliferation at different time points. (K–M) The mRNA levels of YAP, PCNA, Cyclin A1 and Cyr61 were quantified by quantitative real‐time PCR (qRT‐PCR) in untreated and UVB treated HaCaT (n = 3). The data are presented as the means ± SEM. ***P < 0.001, **P < 0.01, *P < 0.05, ### P < 0.001, ## P < 0.01 vs. the corresponding untreated group