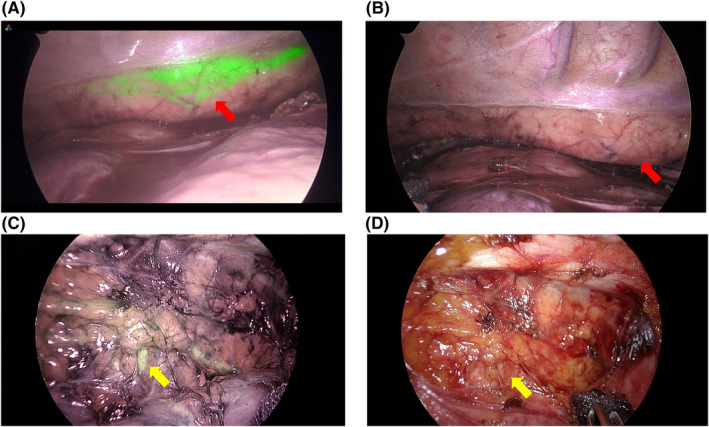
FIGURE 2.

Image of the plexiform pattern and the branching of thoracic duct. (A,B) Red arrow shows the plexiform pattern of the thoracic duct. (A) the plexiform pattern is clearly visualized by indocyanine green (ICG) fluorescence. (B) When near‐infrared (NIR) fluorescence imaging is turned off, the recognition of the plexiform pattern becomes unclear. (C,D) The yellow arrow indicates branching of the thoracic duct in the upper mediastinum. (C) NIR fluorescence imaging. (D) image using normal light
