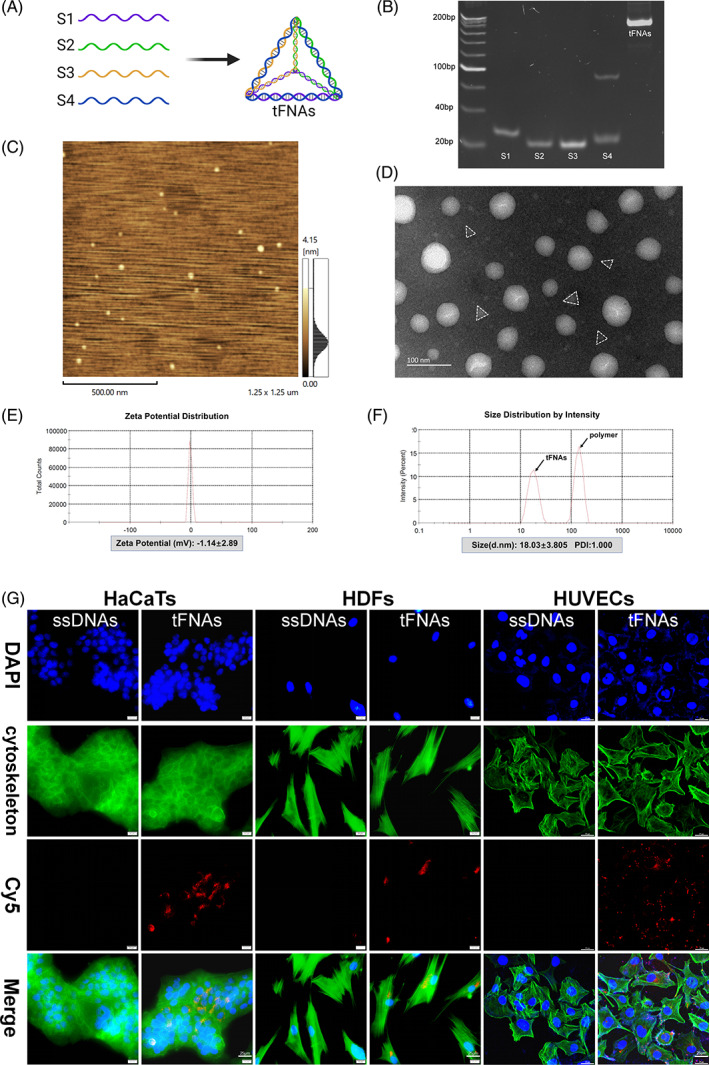
FIGURE 1.

Preparation, characterization and cellular uptake of tFNAs. (A) Schematic illustration of the synthesis of tFNAs. (B) PAGE examination of the molecular weights. (C) AFM evaluation of the tFNAs. The scale bar is 500 nm. (D) TEM evaluation of the tFNAs. The scale bar is 100 nm. (E) Size distribution of the tFNAs. (F) Zeta potential distribution of the tFNAs. (G) Cellular uptake of tFNAs and ssDNAs (Cy5‐tFNAs and Cy5‐ssDNAs: red; nucleus: blue; cytoskeleton: green). Scale bars are 25 μm
