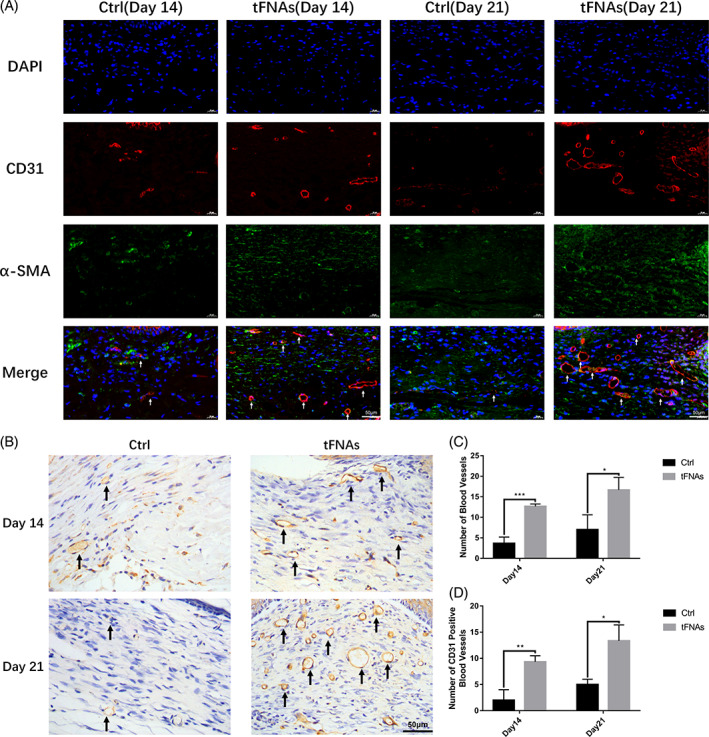
FIGURE 4.

tFNAs increased vascularization in diabetic wounds. (A) Immunofluorescence staining of CD31 and α‐SMA expression of the control and tFNAs groups (white arrow: vessel; nucleus: blue; CD31: red; α‐SMA: green). Scale bars are 50 μm. (B) Immunohistochemical staining of CD31 expression of the control and tFNAs groups (black arrow: vessel). The scale bar is 50 μm. (C) Quantification analysis of the number of CD31‐ and α‐SMA‐positive blood vessels between the control and tFNAs groups. (D) Quantification analysis of the number of CD31‐positive blood vessels between the control and tFNAs groups. Data are presented as the mean ± SD (n = 3). Significance: *p < 0.05, **p < 0.01, ***p < 0.001
