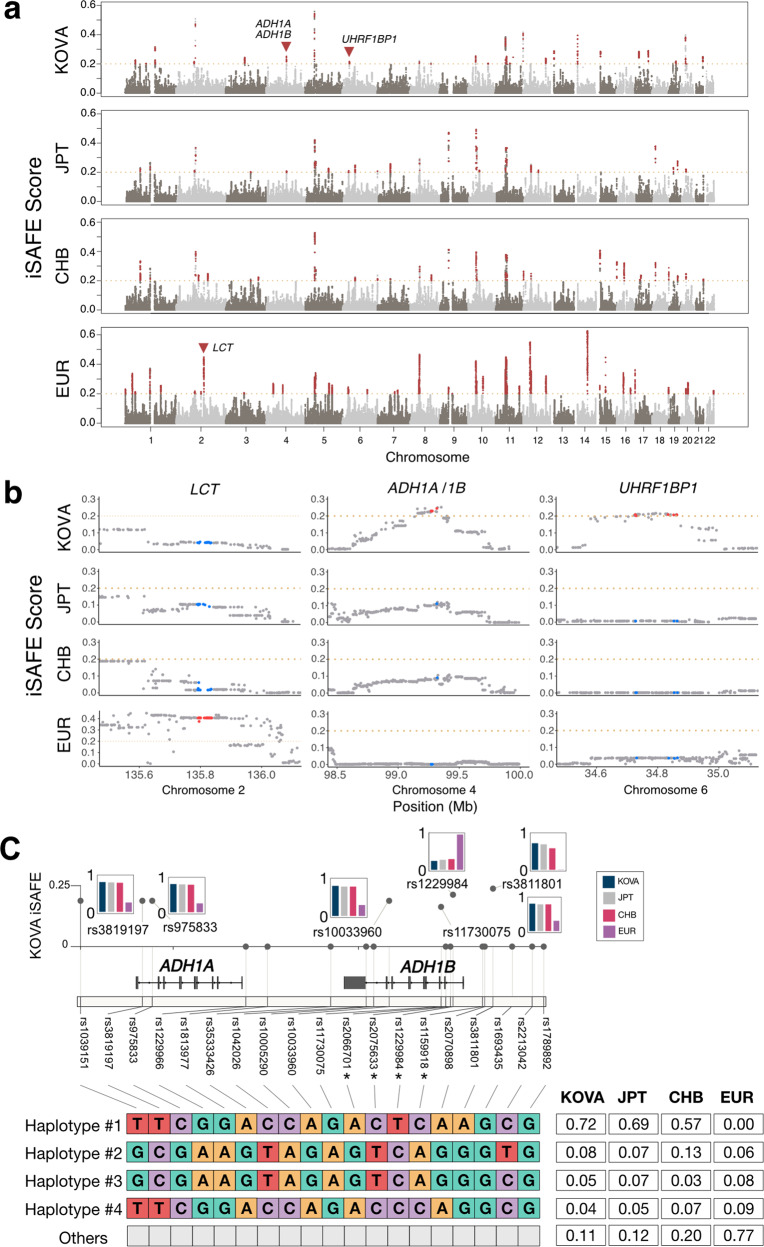
Fig. 2. Signature of positive selection as indicated by the iSAFE score.
a Genome-wide iSAFE values were obtained using KOVA 2, Japanese, Chinese, and European cohorts. Gene loci indicated with triangles are separately displayed in b. b Regional plots of the iSAFE values from the same set of ethnic cohorts, as marked in a. c The KOVA iSAFE scores of selected tag SNPs in the ADH1A/1B locus (top) and their haplotype frequencies by population (bottom). Bar plots denote the MAF of designated SNPs in each population, and SNPs with asterisks denote major markers for haplotype identification used in Han et al., 200742.

