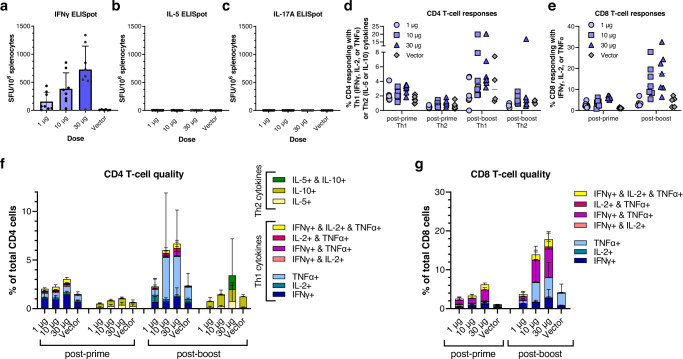
Fig. 5. Detailed cellular immunogenicity profiles of optimized SARS-CoV-2 D614G-2P-3Q saRNA/NLC vaccine (AAHI-SC2) after prime or prime-boost immunization of C57BL/6 J mice.
a SARS-CoV-2 spike-reactive spleen-resident IFNγ+ T cells by ELISpot. SFU = spot forming units. Results show mean and standard deviation (SD). b SARS-CoV-2 spike-reactive spleen-resident IL-5+ T cells by ELISpot. Results shows mean and SD. c SARS-CoV-2 spike-reactive spleen-resident IL-17-A+ T cells by ELISpot. Results shows mean and SD. CD4 (d) and CD8 (e) T cells responding with any Th1 (IFNγ, IL-2, or TNFα) or Th2 (IL-5 or IL-10) cytokines post-prime and post-boost were plotted representing the total number of responding cells, for CD4 or CD8 cells per mouse. Horizontal lines show median. f, g Quality of responding CD4 and CD8 T cells. Total Th1 or Th2 responses were subdivided by cells responding with one, two, or three cytokine(s) to show magnitude and quality of Th1 and Th2 responses, with bar graphs showing the average percentage across each group of mice. The vector control represents mice injected with 10 μg of NLC-complexed saRNA expressing the non-immunogenic secreted embryonic alkaline phosphatase (SEAP) gene. Results show mean and SD. n = 6 mice for SEAP control group and n = 8 for dosing groups.

